

Over the past couple of weeks, Indian stock markets have witnessed a sharp correction, with the Nifty index experiencing a decline of 12-15%. Similarly, Sensex historical data reflects significant volatility. However, the pain is much deeper when we look at individual stocks where more than 200 companies from the Nifty 500 have seen their stock prices tumble by over 35%. While many factors are contributing to this downturn, where many are quick to point fingers at high valuations of the Indian market following a strong and long rally, the picture is much more complex.
Definitely, high valuations is one of the strong reasons for market fall where after a huge rally, stock valuations were stretched to extreme levels and now reality is catching up with them. However, on top of this, fears of a potential tariff war with the US, following their warnings to Canada and Mexico, have fueled the fire, leading to a massive sell-off by FIIs. Further uncertainty is being created by the upcoming budget on February 1, which could introduce a new direct tax code, adding yet another layer of concern.
So, all of these factors together have created panic in the market, making this correction not just expected, but almost unavoidable. However, perhaps the most crucial reason behind this market downturn lies in a clear economic slowdown, which is showing up in weaker-than-expected quarterly results.
As the market shifts firmly into bear territory, even fundamentally strong companies that were once viewed as strong performers are not immune and are being punished, primarily because of their inflated valuations. The challenge at this point is companies that are growing at a good rate are already commanding a high valuation. Although we’ve seen a decent correction, valuations are still stretched for most companies and companies where valuations are reasonable, are posting weak numbers which mainly include the banking sector. So the opportunities are very limited at this point but today’s article will be all about identifying that opportunity — which sector can outperform in 2025, with the help of insights from 12 years of historical data.
Also Read: Candlestick Patterns: Definition, History and Its Types
Table of Contents
Introduction
If we look at the current market scenario then it seems like this pain may persist for a few months but just like every correction in the past, it will create a great opportunity for investment at a decent valuation. The good thing is unlike earlier corrections, where stock prices would fall and quickly recover, this time there would be ample time to invest. Of course, it won’t be easy to see your portfolio in red and it would require a lot of patience and conviction but that is what is going to separate winners from losers in the stock market.
Now, that we are in Q3 results season, I’m closely tracking more than 200 companies and in the coming articles, I will share the update on some key results on my website as well. So, stay tuned to equityinsights.in for further updates. All right let’s get started with this article.
Also Read: Zaggle Prepaid Share: A Promising Investment or Risky Bet?
Volatility in the Market
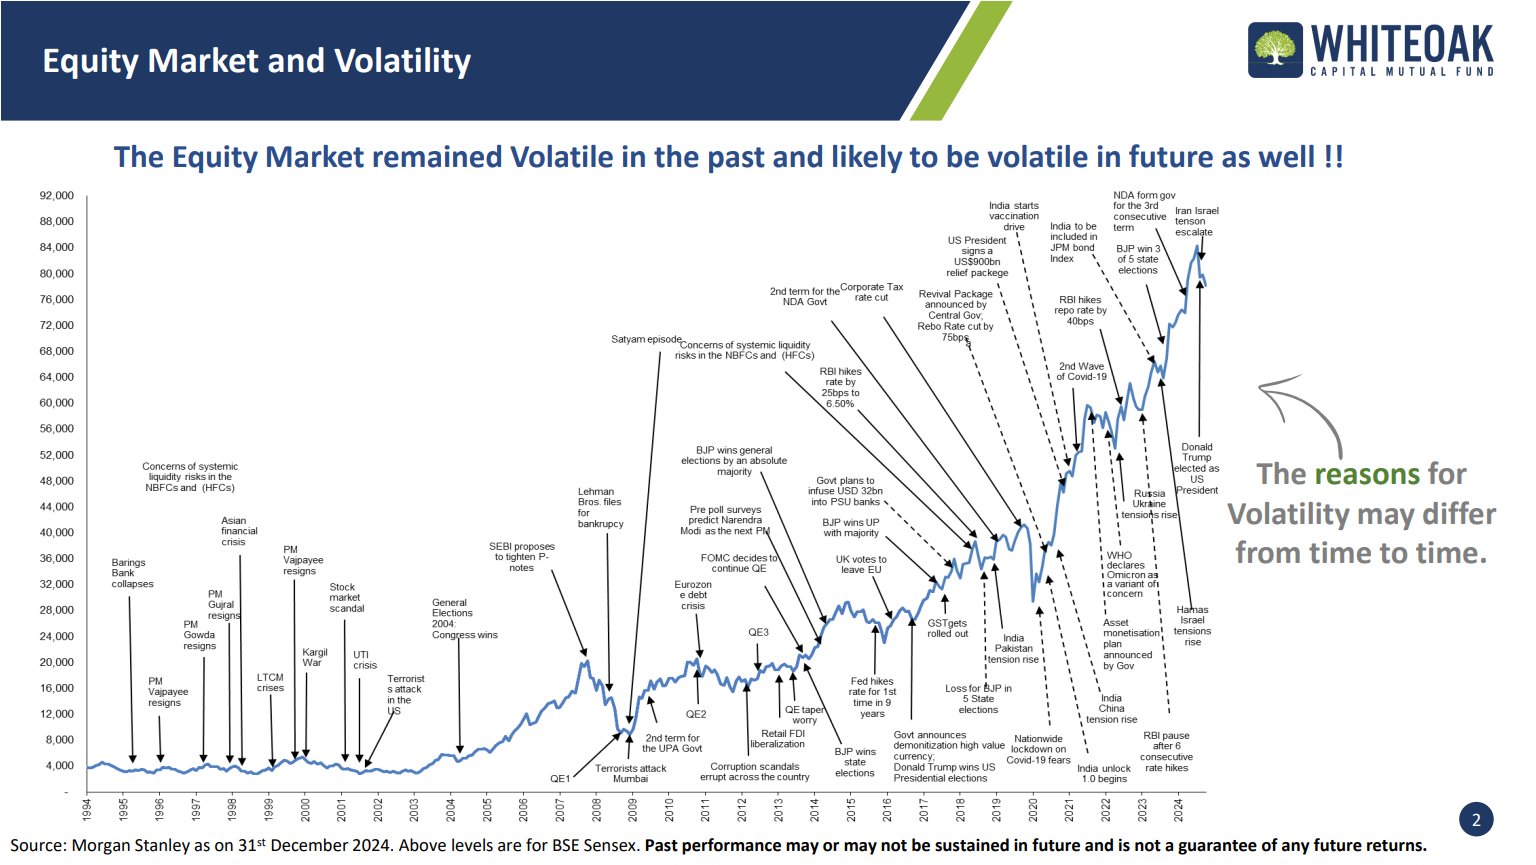
Before we discuss the sectoral rotation part, let’s touch base upon this particular image of Sensex historical data, that beautifully explains the volatility in the Indian stock market where whenever the market has corrected and consolidated in the past, there has been a different reason for the correction.
The purpose of showing this image is to highlight a key point: the equity market has always been volatile in the past and is likely to remain in the future as well. It is just that there’s going to be a different reason for volatility in the future. So, the only way to create wealth in the stock market lies in embracing volatility as it will always going to be part of your journey.
Shift in Market Dynamics from 2012 to 2024
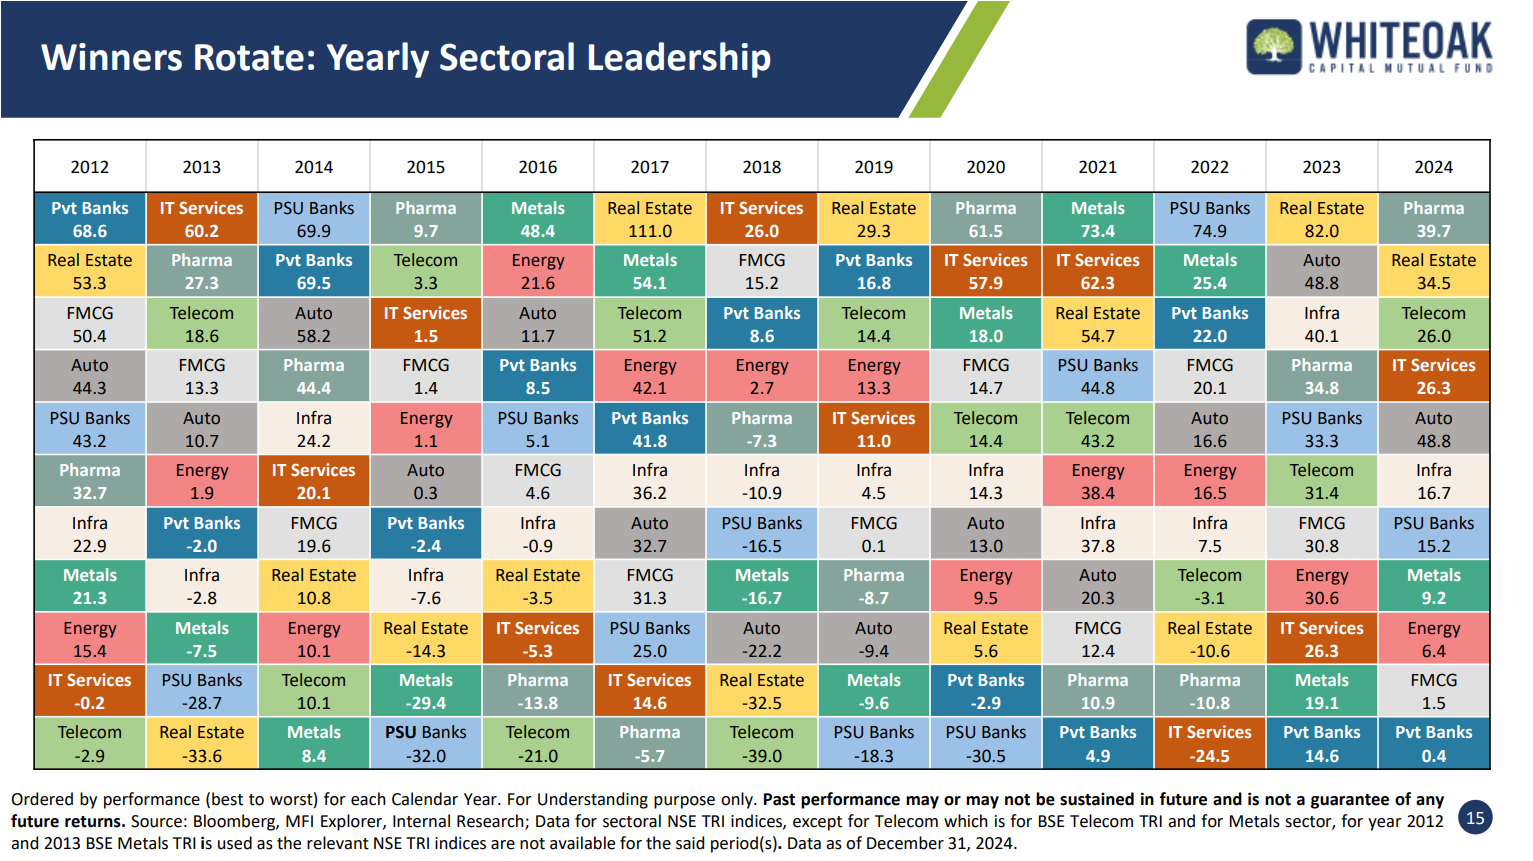
Next, let’s move on to the sectoral rotation image. The image above provides a clear and compelling visual of sectoral rotations in the Indian market from 2012 to 2024, highlighting key trends and transformations. If you take a close look at this image, you’ll notice a fascinating trend: every year, a new sector rises to the top.
Between 2012 and 2014, the Indian share market underwent significant shifts due to various economic, political and global events. In 2012, market sentiment was largely influenced by policy paralysis, slowing GDP growth and high inflation, leading to underperformance in several sectors like Telecom, IT Services and Energy. However, the RBI’s liquidity measures and global central bank interventions provided some support to equities.
In 2013, the infamous “taper tantrum” triggered by the U.S. Federal Reserve’s announcement of reducing its bond-buying program led to a sharp depreciation of the Indian rupee and a massive sell-off in emerging markets, including India. This period also saw the Indian economy grappling with a high current account deficit and inflationary pressures, causing volatility in the share market in the banking sector specifically.
In 2014, the newly elected government came to power with a decisive majority, instilling a wave of optimism in the market. Their clear policy direction, economic revival measures and anticipated structural reforms fueled a strong bull run, with sectors like infrastructure, banking and manufacturing emerging as key outperformers. Since then, despite the continuity of the same leadership, the Indian market has experienced dynamic sectoral rotations each year, playing a vital role in shaping long-term investor confidence and redefining the nation’s economic trajectory.
Market Dynamics in 2012 and 2013
Let’s look at the shift in market dynamics from 2012 to 2013. In 2012, Private Banks led the charge with an impressive 68.6% return, while Real Estate followed closely behind. But fast forward to 2013, and the story takes a turn—Real Estate, which was the second-best performer, plunged to the bottom, while Telecom, previously at the very bottom, made an impressive jump to become the third-best performer. Even IT Services, sitting near the bottom of the pack in 2012, surged ahead to claim the top spot in 2013. This dynamic rotation highlights how rapidly sectors can shift, offering valuable insights for investors looking to understand market trends.
Below is the table showing the outperformers and underperformers in 2013:
Outperformers
| Sector | Annual Return (%) |
|---|---|
| Private Banks | 68.6% |
| Real Estate | 53.3% |
| FMCG | 50.4% |
Underperformers
| Sector | Annual Return (%) |
|---|---|
| Telecom | -2.9% |
| IT Services | -0.2% |
| Energy | 15.4% |
Highlights of 2012: In 2012, Private Banks, Real Estate and FMCG led the charge as the top performers, delivering impressive returns of 68.6%, 53.3% and 50.4% respectively. Meanwhile, Telecom, IT Services and Energy struggled, landing among the underperformers that year.
Below is the table showing the outperformers and underperformers in 2013:
Outperformers
| Sector | Annual Return (%) |
|---|---|
| IT Services | 60.2% |
| Pharma | 27.3% |
| Telecom | 18.6% |
Underperformers
| Sector | Annual Return (%) |
|---|---|
| Real Estate | -33.6% |
| PSU Banks | -28.7% |
| Metals | -7.5% |
Highlights of 2013: In 2013, IT Services, Pharma and Telecom stole the spotlight as the top performers, delivering standout returns of 60.2%, 27.3% and 18.6% respectively. On the flip side, Real Estate, PSU Banks and Metals were left behind, posting disappointing returns of -33.6%, -28.7% and -7.5%, respectively and failing to make any significant impact.
Also Read: Trading Economics: How Economic Events Impact Stock Market?
Market Dynamics in 2014
In 2013, IT Services, which had been the top performer, saw itself slip to the middle of the pack in 2014 whereas PSU Banks, which had been a major underperformer and ranked second from the bottom, turned things around completely, emerging as the top performer. Both Private Banks and the Automobile sector, which had faced challenges in 2013 following the huge rally in 2012, made a powerful comeback in 2014. They bounced back with remarkable strength, reclaiming their top positions and securing the second and third spots, respectively.
Outperformers
| Sector | Annual Return (%) |
|---|---|
| PSU Banks | 69.9% |
| Private Banks | 69.5% |
| Auto | 58.2% |
Underperformers
| Sector | Annual Return (%) |
|---|---|
| Metals | 8.4% |
| Telecom | 10.1% |
| Energy | 10.1% |
Highlights of 2014: In 2014, PSU Banks, Private Banks, and the Automobile Sector surged to the top, posting impressive returns of 69.9%, 69.5%, and 58.2%, respectively. Meanwhile, Metals, Telecom and Energy struggled with just 8.4%, 10.1% and 10.1% returns, respectively, failing to keep up with the market’s momentum and falling behind as underperformers.
Market Dynamics in 2015
Looking at the data from 2015, Telecom had a tough year in 2014, but in 2015, it made a stunning comeback, becoming the second-best performer. If you examine this pattern closely, you’ll notice something interesting: Telecom seems to follow a unique rhythm. After underperforming and staying in the bottom three spots, it consistently bounces back to outperform in the following year, often breaking into the top three. This pattern is clear when you look at the data from 2012 to 2019, where every time Telecom struggled and ranked among the bottom three, it made a strong recovery the next year by achieving the top three spots.
However, since 2020, Telecom has stayed in a more stable position, never returning to the bottom three after its strong performance in 2019. Now, in 2024, Telecom has once again outperformed, landing in the top three. Following this pattern, it’s reasonable to anticipate that Telecom might face a downturn in 2025, potentially slipping back into the bottom three which signals to at least remain away from this sector in 2025, if we are to follow this data. This unique cyclical trend offers intriguing insights for investors keeping an eye on sectoral performance.
Outperformers
| Sector | Annual Return (%) |
|---|---|
| Pharma | 9.7% |
| Telecom | 3.3% |
| IT Services | 1.5% |
Underperformers
| Sector | Annual Return (%) |
|---|---|
| PSU Banks | -32.0% |
| Metals | -29.4% |
| Real Estate | -14.3% |
Highlights of 2015: The market didn’t perform well in 2015 and even the top performers in that year which include Pharma, Telecom and IT Services were able to generate only 9.7%,3.3% and 1.5% and the bottom performers closed the year with negative returns.
Market Dynamics in 2016
If you look at Pharma, it was the top performer in 2015, but in 2016, it drastically shifted, landing as the second worst performer. As for Telecom, we’ve already seen its pattern: after a strong year, it followed suit and ended up being the worst performer in 2016. Meanwhile, Metals, which had been struggling and underperforming for several years, suddenly made a dramatic comeback. After three consecutive years of disappointing results, Metals shot to the top in 2016, surprising many.
Outperformers
| Sector | Annual Return (%) |
|---|---|
| Metals | 48.4% |
| Energy | 21.6% |
| Auto | 11.7% |
Underperformers
| Sector | Annual Return (%) |
|---|---|
| Telecom | -21.0% |
| Pharma | -13.8% |
| IT Services | -5.3% |
Highlights of 2016: Metals was able to generate returns of 48.4% while the Energy sector generated 21.6% in 2016. On the other hand, the underperformers include Telecom, Pharma, IT Services, Real Estate and Infra, all closed with negative returns.
Also Read: Stock Analysis: Things to Follow & Avoid in the Stock Market
Market Dynamics in 2017
In 2017, Real Estate, which had struggled for the past four years—only posting a small positive return in 2014 and giving negative returns in the other years—made an incredible comeback. It soared to the top, delivering a staggering 111% return, the highest ever by any sector from 2012 to 2024. Metals followed as the second-best performer, while Telecom, sticking to its pattern, secured the third spot that year. This remarkable turnaround highlights just how quickly sector fortunes can shift.
Outperformers
| Sector | Annual Return (%) |
|---|---|
| Real Estate | 111.0% |
| Metals | 54.1% |
| Telecom | 51.2% |
Underperformers
| Sector | Annual Return (%) |
|---|---|
| Pharma | -5.7% |
| IT Services | 14.6% |
| PSU Banks | 25.0% |
Highlights of 2017: Real Estate generated humongous wealth for their investors in 2017 and the return was so huge that second best performer — Metals delivered over 54% returns but still was less than half of it, while the underperformers were Pharma, IT Services and PSU Banks (still closed with 25% returns).
Market Dynamics in 2018
After a massive rally in 2017, both Real Estate and Telecom saw a dramatic reversal in 2018, wiping out significant wealth for investors. The Telecom sector gave a return of -39% (the highest negative return from 2012-24) followed by a -32.5% return by Real Estate. 2017 wasn’t a good year for investors as 7 out of 11 sectors closed in negative however on the bright side, IT Services, FMCG and Private Banks emerged as the top performers, securing the first, second and third spots, but with more modest returns compared to the previous year’s highs.
Outperformers
| Sector | Annual Return (%) |
|---|---|
| IT Services | 26.0% |
| FMCG | 15.2% |
| Private Banks | 8.6% |
Underperformers
| Sector | Annual Return (%) |
|---|---|
| Telecom | -39.0% |
| Real Estate | -32.5% |
| Auto | -22.2% |
Highlights of 2018: Wasn’t a good year for investors where the highest return was for IT services — 26%, while the rest were only able to deliver average returns and the lowest was for Telecom as already discussed above.
Market Dynamics in 2019
In the year 2019, while IT Services experienced a decline in its position but still delivered positive return, Private Banks moved up a place to achieve second position, emerging as one of the strong performers. Meanwhile, Real Estate which ended the previous year with a huge negative return of 32.5%, took the lead by delivering an impressive return of 29.3%. Telecom followed its pattern to claim the third spot. This highlights a powerful lesson: choosing the right sector during a market dip can create substantial wealth, turning challenges into opportunities.
Outperformers
| Sector | Annual Return (%) |
|---|---|
| Real Estate | 29.3% |
| Private Banks | 16.8% |
| Telecom | 14.4% |
Underperformers
| Sector | Annual Return (%) |
|---|---|
| PSU Banks | -18.3% |
| Metals | -9.6% |
| Auto | -9.4% |
Highlights of 2019: Most sectors delivered average returns at the end of 2019, with only Real Estate delivering a stellar 29.3% return. On the flip side, PSU Banks, Metals, Auto and Pharma struggled and closed the year with negative returns.
Also Read: Investment: The Key to Secure Your Financial Future
Market Dynamics in 2020
2020 was the year of the Pandemic, but still was a good year for investors as all the sectors except banking including both PSU Banks and Private Banks closed in positive
2020, despite being a year defined by the global pandemic because of COVID-19, turned out to be surprisingly rewarding for investors. While the world faced unprecedented challenges, the stock market delivered a positive surprise with challenges turning into opportunities. Every sector, except for banking—encompassing both PSU and Private Banks—ended the year in the green.
Industries like Pharmaceuticals benefitted from heightened demand driven by the fear of COVID-19, while government stimulus measures provided a boost, enabling them to thrive in challenging times. Similarly, IT Services experienced a surge in demand as the world shifted to remote work during the lockdown, allowing them to seize the opportunity and capitalize on the new, digital-first environment.
So, even amidst volatility, smart investors were able to ride the wave of recovery, making 2020 a testament to how, with the right strategy, opportunities can emerge from adversity. This year reinforced the timeless lesson that diversification and sectoral insight can be key drivers of long-term success, even in the most unpredictable times.
Outperformers
| Sector | Annual Return (%) |
|---|---|
| Pharma | 61.5% |
| IT Services | 57.9% |
| Metals | 18.0% |
Underperformers
| Sector | Annual Return (%) |
|---|---|
| PSU Banks | -30.5% |
| Private Banks | -2.9% |
| Real Estate | 5.6% |
Highlights of 2020: In 2020, the Pharma, IT Services and Metals sectors dominated the market, delivering remarkable returns of 61.5%, 57.9%, and 18% respectively. These industries surged ahead, capitalizing on the market’s momentum. On the flip side, sectors like PSU Banks, Private Banks and Real Estate faced significant challenges, with returns of -30.5%, -2.9%, and 5.6%, respectively. Struggling to keep pace, they lagged as the market’s underperformers.
Market Dynamics in 2021 and 2022
Since 2018, the Metals sector has struggled, posting negative returns every year except for 2020. However, in 2021, it made a remarkable comeback, achieving the top spot with a stellar 73.4% return. It continued its strong performance into 2022, securing the second position with a solid 25.4% return.
Meanwhile, PSU Banks, which had been struggling and underperforming for several years, suddenly made a dramatic comeback. After six consecutive years of disappointing results, PSU Banks became the fourth-best performer in 2021 and in 2022, they took an even more remarkable leap, rising to the top with an outstanding return of nearly 75%.
Below is the table showing the outperformers and underperformers in 2021:
Outperformers
| Sector | Annual Return (%) |
|---|---|
| Metals | 73.4% |
| IT Services | 62.3% |
| Real Estate | 54.7% |
Underperformers
| Sector | Annual Return (%) |
|---|---|
| Private Banks | 4.9% |
| Pharma | 10.9% |
| FMCG | 12.4% |
Highlights of 2021: In 2021, alongside Metals and PSU Banks, IT Services also delivered strong performance, with every sector ending the year in positive territory.
Below is the table showing the outperformers and underperformers in 2022:
Outperformers
| Sector | Annual Return (%) |
|---|---|
| PSU Banks | 74.9% |
| Metals | 25.4% |
| Private Banks | 22.0% |
Underperformers
| Sector | Annual Return (%) |
|---|---|
| IT Services | -24.5% |
| Pharma | -10.8% |
| Real Estate | -10.6% |
Highlights of 2022: In 2022, however, Private Banks emerged as one of the top performers, following PSU Banks and Metals. On the other hand, IT services were the worst performer in 2022 as Foreign Institutional Investors (FIIs) pulled their money from the Indian Market as the Federal Reserve increased the interest rates. Since the technology space, attracted the maximum investments from FIIs in 2021, which even resulted in a massive rally in this space, the withdrawal of their funds, led to the sharp decline in technology stocks.
Overall, the years 2021 and 2022 created humongous wealth for investors in the Metal and PSU Banks space, which has been underperforming for the last 4-6 years as these years unlocked the potential of undervalued sectors and their stocks.
Market Dynamics in 2023
In 2023, the Real Estate sector generated 82% return and was the top performer, while the second and third spot was achieved by the Auto and Infra sectors respectively with both delivering more than 40% return.
Outperformers
| Sector | Annual Return (%) |
|---|---|
| Real Estate | 82.0% |
| Auto | 48.8% |
| Infra | 40.1% |
Underperformers
| Sector | Annual Return (%) |
|---|---|
| Private Banks | 14.6% |
| Metals | 19.1% |
| IT Services | 26.3% |
Highlights of 2023: 2023 was the second year (after 2021) where all the sectors closed in positive and even the lowest return was 14.6%, achieved by the Private Banks.
Market Dynamics in 2024
For the second consecutive year, investors saw positive returns across the board, as every sector closed the year in the green. According to sector-specific data, this remarkable performance ensured that all market participants enjoyed gains, reinforcing the strength and resilience of the broader market.
Outperformers
| Sector | Annual Return (%) |
|---|---|
| Pharma | 39.7% |
| Real Estate | 34.5% |
| Telecom | 26.0% |
Underperformers
| Sector | Annual Return (%) |
|---|---|
| Private Banks | 0.4% |
| FMCG | 1.5% |
| Energy | 6.4% |
Highlights of 2024: Pharma, Real Estate and Telecom were the outperformers delivering a return of 39.7%, 34.5% and 26% respectively. In fact, in 2024, Real Estate became the sector to have generated great wealth for investors for two straight years whereas Energy, FMCG and Private Banks generated lower-than-average returns.
Also Read: 10 Trading Rules That Make a Trader Successful
Overall Summary of Outperformers and Underperformers
Here is a summary of the top-performing and underperforming stocks for each year from 2012 to 2014 in the table below:
| Year | Outperformers | Returns % | Underperformers | Returns % |
| 2012 | Private Banks | 68.6 | Telecom | -2.9 |
| Real Estate | 53.3 | IT Services | -0.2 | |
| FMCG | 50.4 | Energy | 15.4 | |
| 2013 | IT Services | 60.2 | Real Estate | -33.6 |
| Pharma | 27.3 | PSU Banks | -28.7 | |
| Telecom | 18.6 | Metals | -7.5 | |
| 2014 | PSU Banks | 69.9 | Metals | 8.4 |
| Private Banks | 69.5 | Telecom | 10.1 | |
| Auto | 58.2 | Energy | 10.1 | |
| 2015 | Pharma | 9.7 | PSU Banks | -32.0 |
| Telecom | 3.3 | Metals | -29.4 | |
| IT Services | 1.5 | Real Estate | -14.3 | |
| 2016 | Metals | 48.4 | Telecom | -21.0 |
| Energy | 21.6 | Pharma | -13.8 | |
| Auto | 11.7 | IT Services | -5.3 | |
| 2017 | Real Estate | 111.0 | Pharma | -5.7 |
| Metals | 54.1 | IT Services | 14.6 | |
| Telecom | 51.2 | PSU Banks | 25.0 | |
| 2018 | IT Services | 26.0 | Telecom | -39.0 |
| FMCG | 15.2 | Real Estate | -32.5 | |
| Private Banks | 8.6 | Auto | -22.2 | |
| 2019 | Real Estate | 29.3 | PSU Banks | -18.3 |
| Private Banks | 16.8 | Metals | -9.6 | |
| Telecom | 14.4 | Auto | -9.4 | |
| 2020 | Pharma | 61.5 | PSU Banks | -30.5 |
| IT Services | 57.9 | Private Banks | -2.9 | |
| Metals | 18.0 | Real Estate | 5.6 | |
| 2021 | Metals | 73.4 | Private Banks | 4.9 |
| IT Services | 62.3 | Pharma | 10.9 | |
| Real Estate | 54.7 | FMCG | 12.4 | |
| 2022 | PSU Banks | 74.9 | IT Services | -24.5 |
| Metals | 25.4 | Pharma | -10.8 | |
| Private Banks | 22.0 | Real Estate | -10.6 | |
| 2023 | Real Estate | 82.0 | Private Banks | 14.6 |
| Auto | 48.8 | Metals | 19.1 | |
| Infra | 40.1 | IT Services | 26.3 | |
| 2024 | Pharma | 39.7 | Private Banks | 0.4 |
| Real Estate | 34.5 | FMCG | 1.5 | |
| Telecom | 26.0 | Energy | 6.4 |
Sectors that can Outperform in 2025
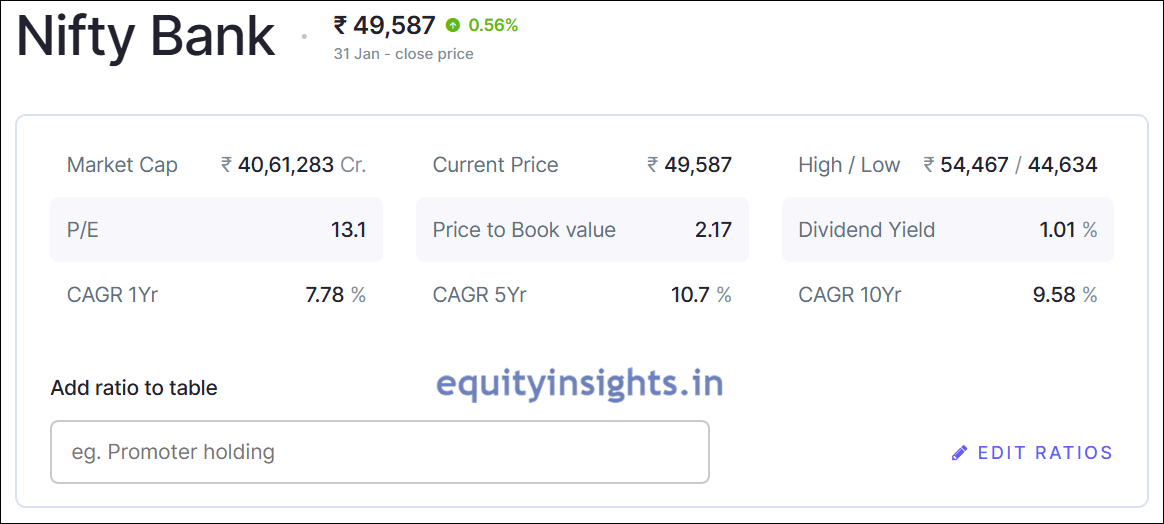
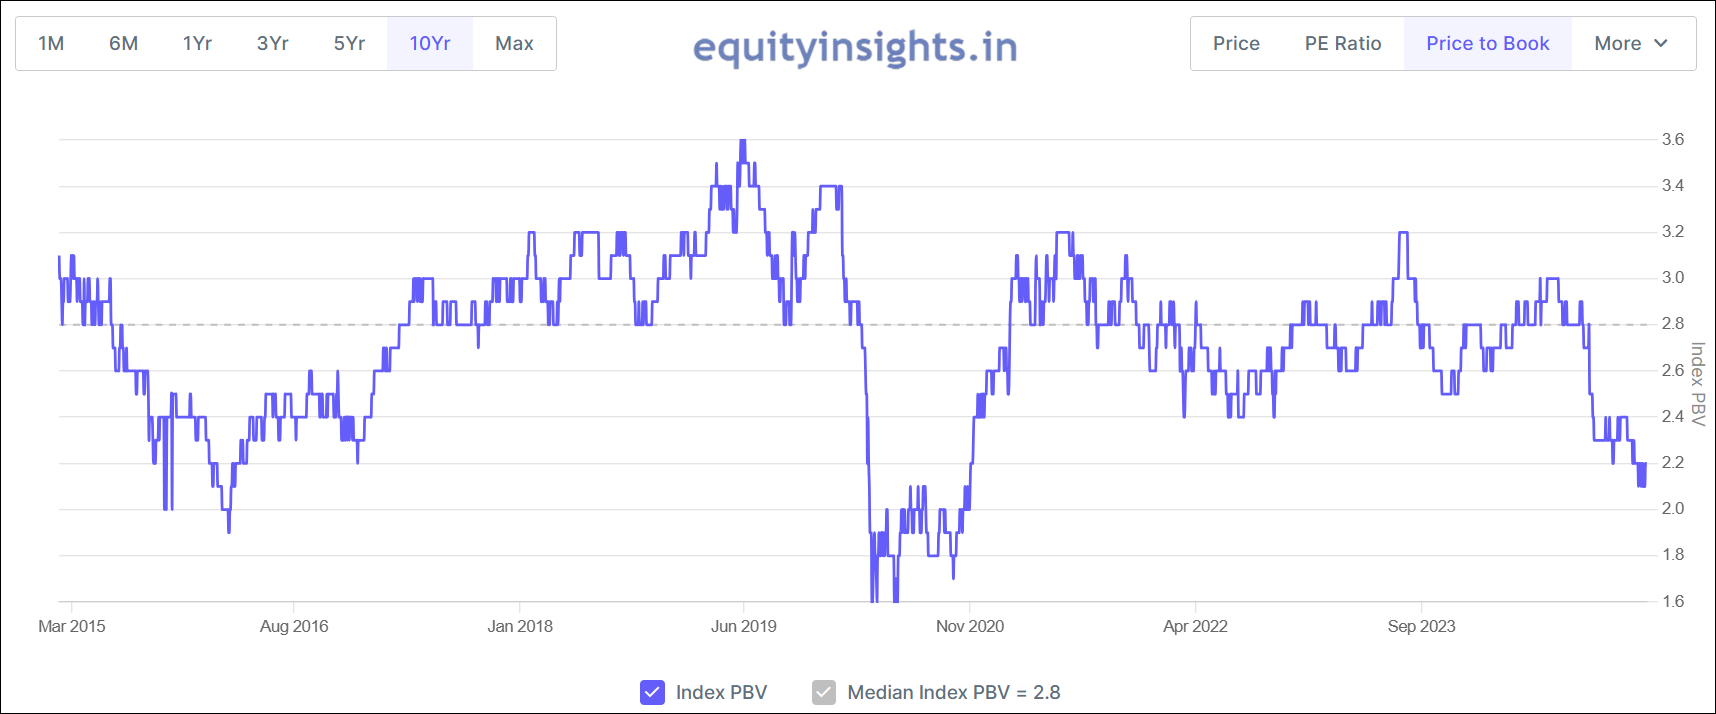
If you take insights from sectoral rotation data, you will notice that over the past seven years, private banks have underperformed, setting the stage for a potential comeback in 2025. A closer look at Bank Nifty historical data reveals a compelling valuation story—its PE ratio stands at just 13.1, while its median Price-to-Book ratio is 2.8 over the period of 10 years. Meanwhile, private banks are currently trading at a Price-to-Book value of 2.17, offering a discount and presenting a promising opportunity for investors looking at a sector poised for recovery.
You can click on individual private banks and look at their valuation. Every private bank today is trading below its median PE in the last 5-10 years. The point here is that private banks that have underperformed big time, can actually outperform in 2025 however the exact time of rally can’t be predicted. We don’t know whether it’s going to be next quarter or it may take two or three more quarters. The only thing that we can do is to stay invested in this sector and have patience till it enjoys the rally.
If you are to focus on any particular bank then you should look at those banks that are focused on secured lending as those banks are doing pretty well. While overall growth remains modest, the real challenge lies with banks heavily exposed to unsecured loans, leading to their ongoing struggles. Having said this, the valuations in majority of the private banks are at almost rock bottom levels. So, it’s going to be very interesting to see, how they perform in 2025.
Another sector is FMCG, which has been one of the bottom performers in 2024 and that’s where I think, this can also do well in 2025-26, once the consumption improves.
So, this has been one analysis that can actually help you understand how the sectoral rotation happens and how a particular sector that outperforms for 1-2 years eventually underperforms because obviously when the returns are too high, the valuations become expensive but during a sector’s recovery, valuations remain undervalued, paving the way for strong future returns.
Conclusion
If we capture the essence of all these, we can see that those sectors that remain underperformed for several years, can deliver an impressive return anytime and as per the above data, it is clearly visible that private banks have remained an under valued sector since 2018, as from 2018 to 2024, it has generated a total of 64.4% return and if we are to calculate in total making it a CAGR of just 9.2%, on the other side if we look at sector like real estate, it has generated CAGR of 36.9% in 8 years from 2017 to 2024, which shows a huge underperformance in private banks sector and same goes with FMCG companies in the stock market.
I hope this particular article will give you a good insight into sectoral rotation. In the upcoming articles, we can particularly discuss the performance of private banks and FMCG companies. I hope you find this content useful. If yes, do share it within your circle. I hope to see you in the next article soon. Till then take care and Happy Investing!
Disclaimer: The information provided in this article is intended solely for educational, illustrative and awareness purposes. Nothing contained herein should be construed as a recommendation. Users are encouraged to seek professional financial advice before making any decisions based on the content provided.