
In the stock market, traders use a variety of technical indicators for trading and one of the most popular tools is candlestick patterns, which are the heart of the price action. Candlestick patterns dominate conversations and remain one of the most popular methods in technical analysis, serving as the go-to tool for traders across equity, commodity and Forex markets to forecast market directions even after centuries of its discovery.
In the previous article of the technical analysis series, we discussed the top 10 trading rules, which are important to build a successful career in the stock market. This time, it is all about one of the effective tools used by traders in the stock market for technical analysis i.e. candlestick patterns. Understanding candlestick patterns is the initial step in the journey of the stock market, providing valuable insights into the true behaviour of the market.
Let us take a moment to understand a bit about the history of candlestick patterns—what they are, their types and how they become the focus and pillars of technical analysis.
Also Read: The Psychology of Money: Key to Stock Market Success
Table of Contents
What is a Candlestick?
Candlestick is a type of price chart (also called Japanese candlestick chart) used in technical analysis to depict price movements over a set period and is based on four key prices: Open, Close, High and Low.
Also Read: Investment: The Key to Secure Your Financial Future
History of Candlestick Charts
The origins of candlestick charts can be traced back to Japan, predating the introduction of bar and point-and-figure charts in the United States.
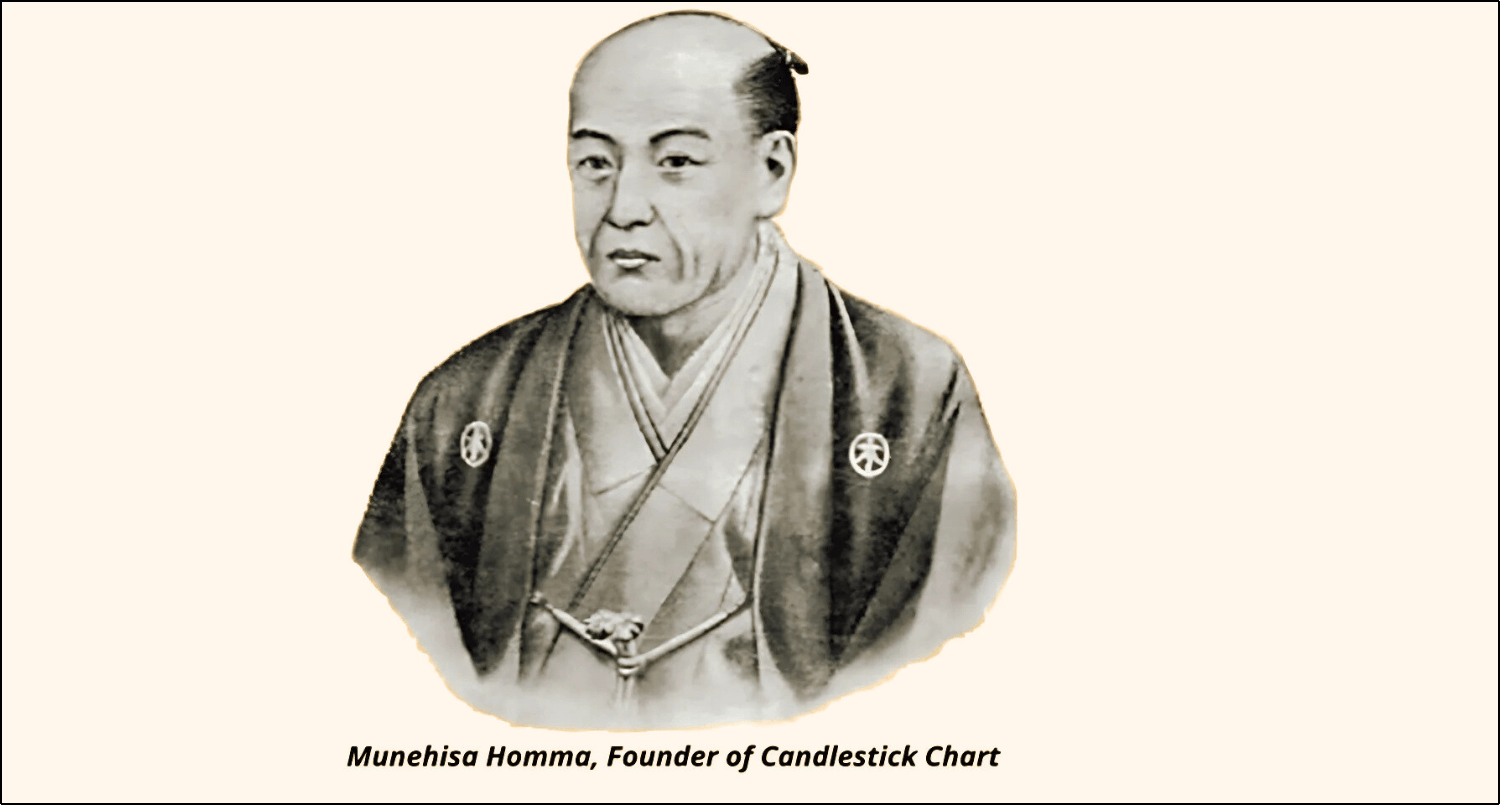
Candlesticks were utilized in Japan during the 18th century for rice trading while the concept was first established in the 17th century by Munehisa Homma, a rice trader who discovered a correlation between rice prices and the supply-demand dynamics. He also noted how the emotions of traders significantly affected the rice prices. Candlesticks were then later introduced to the Western world by Steve Nison in his book “Japanese Candlestick Charting Techniques”, first published in 1991 and that is how this early form of technical analysis laid the foundation for modern trading techniques.
How does a Candlestick Look Like?
Candlestick charts or patterns comprise individual candlesticks, with each candlestick representing a period like a day, week or month in markets. There are two main parts of a candlestick:
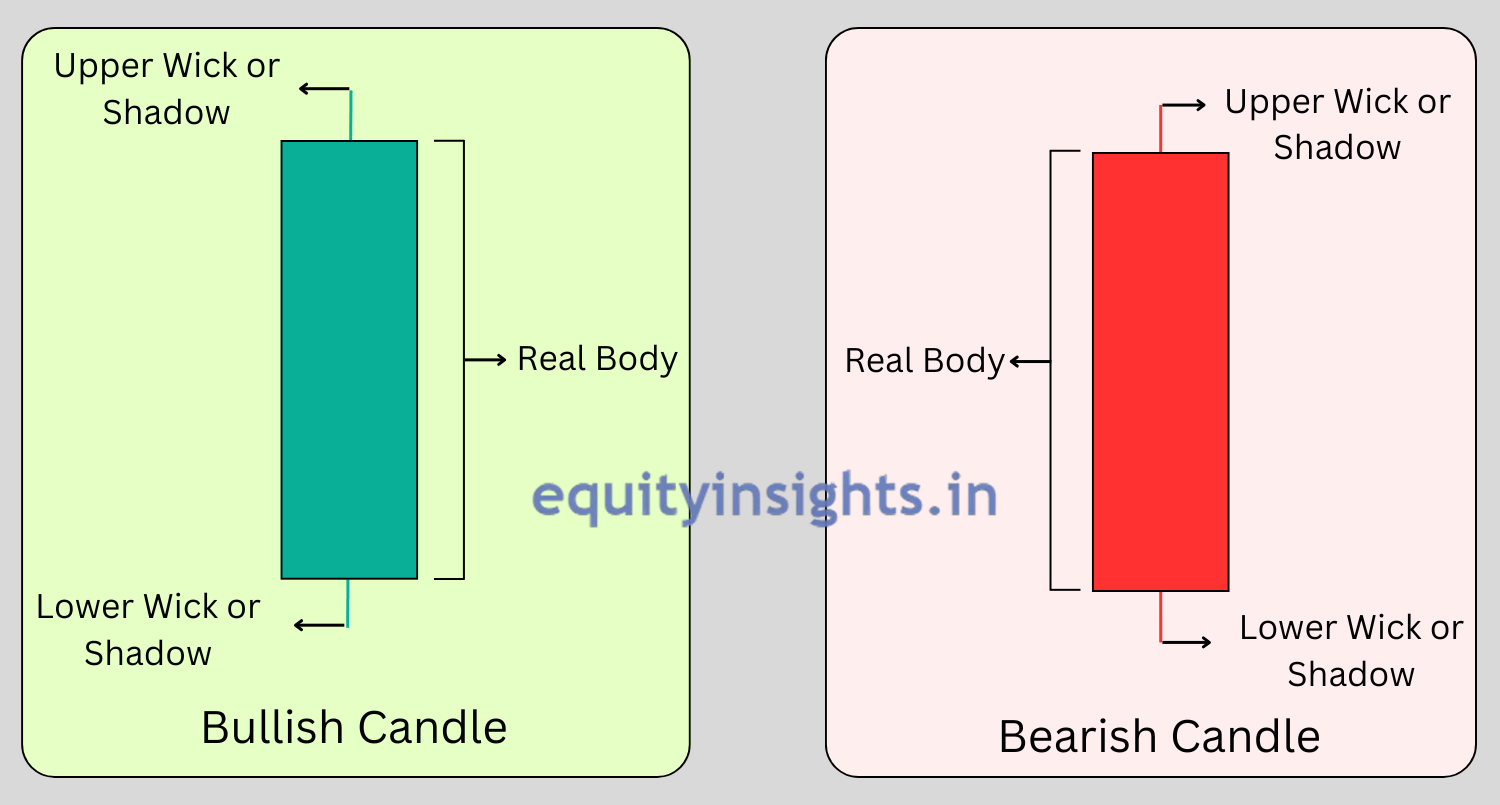
- Body: The broader portion in the candlestick is referred to as the “Real body“, which is rectangular and displays the difference between the opening price and closing price.
- Shadow: The thin lines that appear both above and below the real body are referred to as “wicks” or “shadows“, which indicate the highest and lowest price values for that specific period.
Each candle captures four main elements: the opening price, the highest price reached, the lowest price attained and the closing price for a given period.
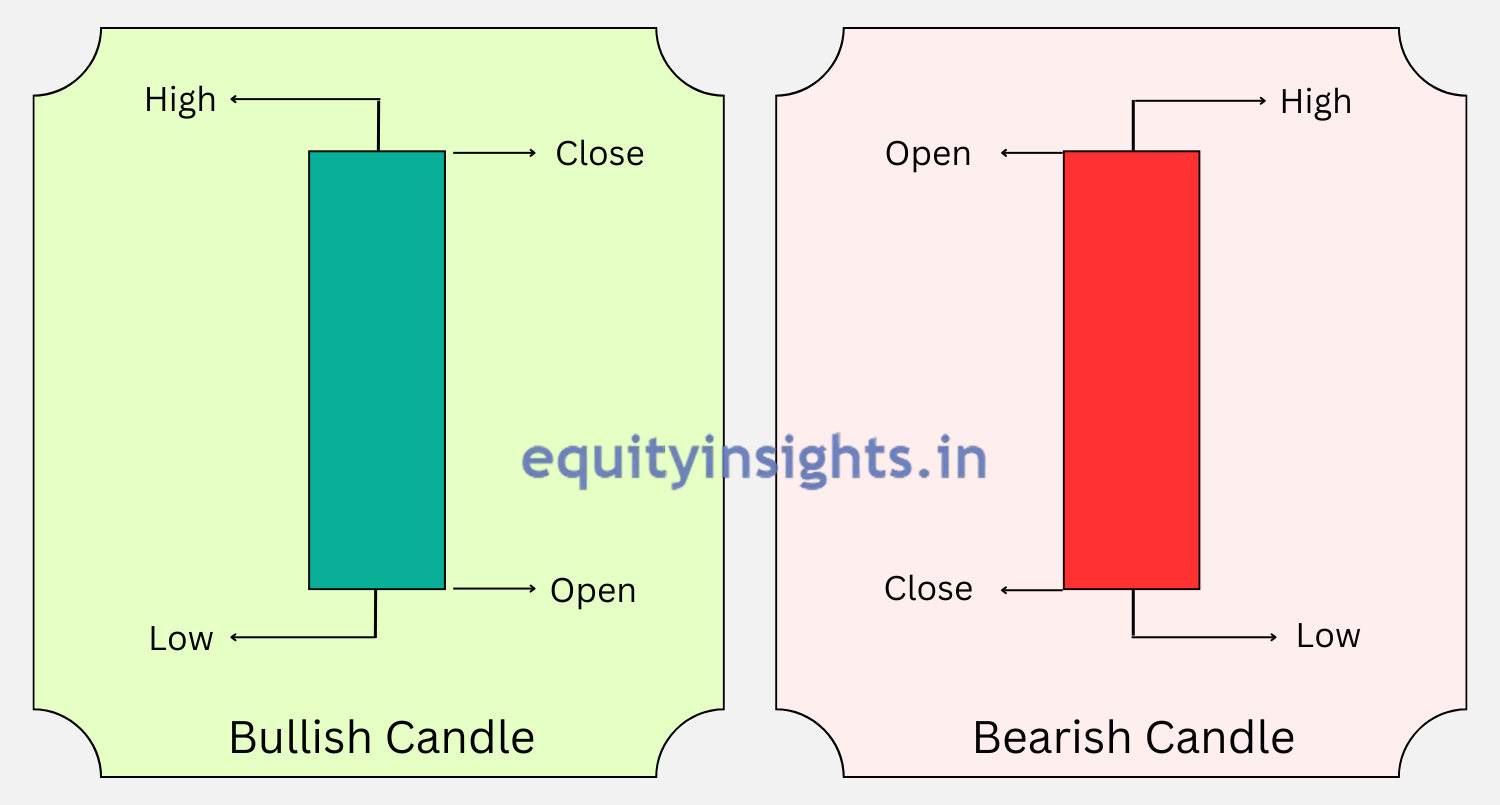
- Opening Price: The opening price of a stock is the price at which the stock begins trading at the start of a specific time period, whether it’s a minute, hour, day or any other time frame. The openings of candles are compared to check whether the market is following a bullish or bearish trend. If the opening price of the current candle is greater than the previous candle’s closing price, it indicates a bullish movement while if the opening price of the current candle is lower than the previous candle’s closing price then it suggests a bearish movement.
- Closing Price: The closing price of a stock is the price at which the stock trades at the end of a specific time period, whether it’s a minute, hour, day or any other time frame.
- Highest Price: The highest price of a candlestick is referred to as “The High”. The High represents the highest value at which a stock has reached during a particular time frame. The increasing highs indicate a bullish trend.
- Lowest Price: The lowest price or a point of a candlestick is referred to as “The Low”. The Low represents the lowest value at which a stock has reached during a particular time frame. The consecutive lows indicate a bearish trend.
The combination of the highs, lows, open and close are used to form candlestick patterns to predict different trends.
The colour of the body tells us the relationship between opening and closing prices; a green or white body could be interpreted in a way that the closing price was higher than the opening and a red or black body means the closing price was lower than the opening price.
What are Candlestick Patterns?
Candlestick patterns serve as valuable indicators of price trends and have a tendency to repeat over time. By studying these patterns, traders can predict short-term price movements and depict market sentiments. Candlestick patterns are mainly categorized into three main types based on their implications for price movement:
- Bullish candlestick patterns: Bullish candlestick patterns are named after inspiration from the action of bulls who use their horns to swing up on other animals. Bullish candlestick patterns in the chart denote that buyers took control of the market and selling pressure has eased or started to ease, indicating the start of an uptrend in the market. In other words, as this pattern is seen in the chart, it depicts that the buyers outnumbered the sellers and therefore the likelihood of the stock price rising increases. Additionally, if the bullish candlesticks have large lower shadows, it indicates that a large number of sellers tried to take the stock lower but in the end, bulls win the battle.
- Bearish candlestick patterns: As the name suggests, these patterns are named after the bears whose action involves using their claws to strike down other animals i.e. downward movement. Bearish candlestick patterns in the chart denote that sellers have taken interest in the stock market and are now controlling the market, indicating that the downtrend has started or is likely to persist now. In simple words, if a bearish pattern is witnessed in the chart, it means that the sellers outnumbered the buyers and the price of the stock is likely to fall from that point onward. Also, if the bearish candlesticks have large upper shadows, it indicates that a large number of buyers tried to resist the sell-off in the stock but in the end, bears win the battle.
- Neutral candlestick patterns: These patterns represent indecision in the market, where neither buyers nor sellers have a clear advantage. These patterns do not strongly indicate whether the price will move up or down but rather show a moment of pause or consolidation. Depending on the context, they can lead to either a continuation of the current trend or a reversal. However, However, it is often observed that when indecision patterns form, it reveals a tug-of-war between buyers and sellers, often hinting at upcoming trend reversals.
Also Read: Stock Analysis: Things to Follow & Avoid in the Stock Market
How to Read Candlestick Patterns?
A candlestick can be read by analyzing its different parts. The body of a candle provides the opening and closing price of a stock. The upper and lower shadows of a candle determine the high and low of the stock. The traders can use the candlesticks to understand the price range of the stock. The green colour in a candlestick is used for its body which depicts the stock in a bullish trend, while the red colour of the body depicts the stock in a bearish trend.
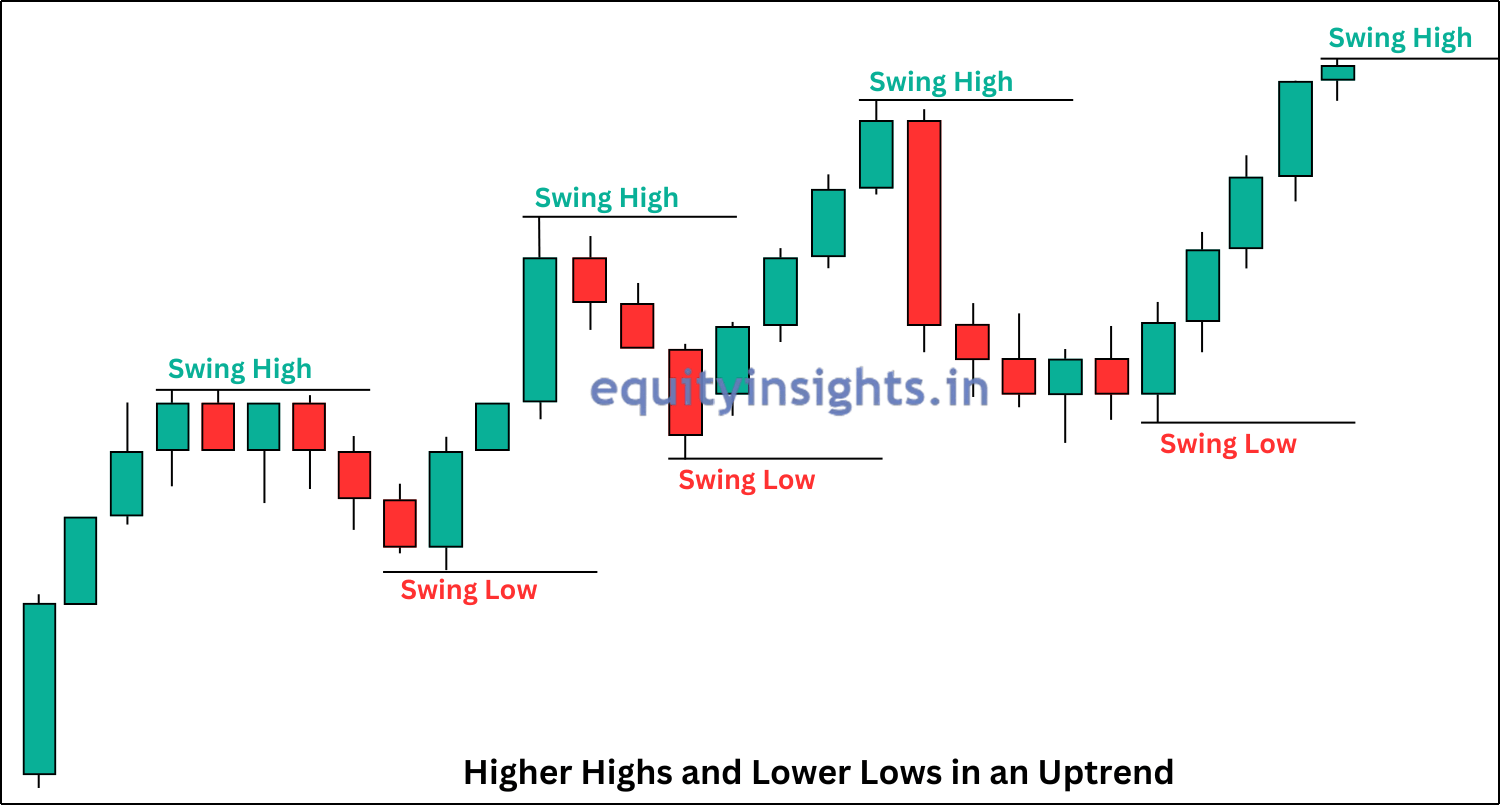
The above figure shows the chart of a stock, that witnessed a huge buying initially reflected by a series of green candlesticks, forming one above the other. Traders can analyze these candlesticks alongside technical tools to decide when to enter the market. After the stock made its first swing high, driven by strong buying activity, it faced a significant sell-off thereafter. This sell-off is shown by a series of red candlesticks, forming below each other. However, the initial fall in the stock price stabilizes after a few candlesticks, followed by an upward movement, represented once again by green candlesticks. Thus, by observing the candlestick patterns, traders can gain valuable insights into market behaviour and make informed decisions.
Additionally, traders can portray the following things by looking at the candlesticks:
- Consecutive red candlesticks denote heavy selling action of the stock.
- A combination of red and green candlestick denotes the volatility of the price.
- Consecutive green candlesticks denote heavy buying action of the stock.
Other details that can be obtained using the candlesticks which are also depicted by the image mentioned above are:
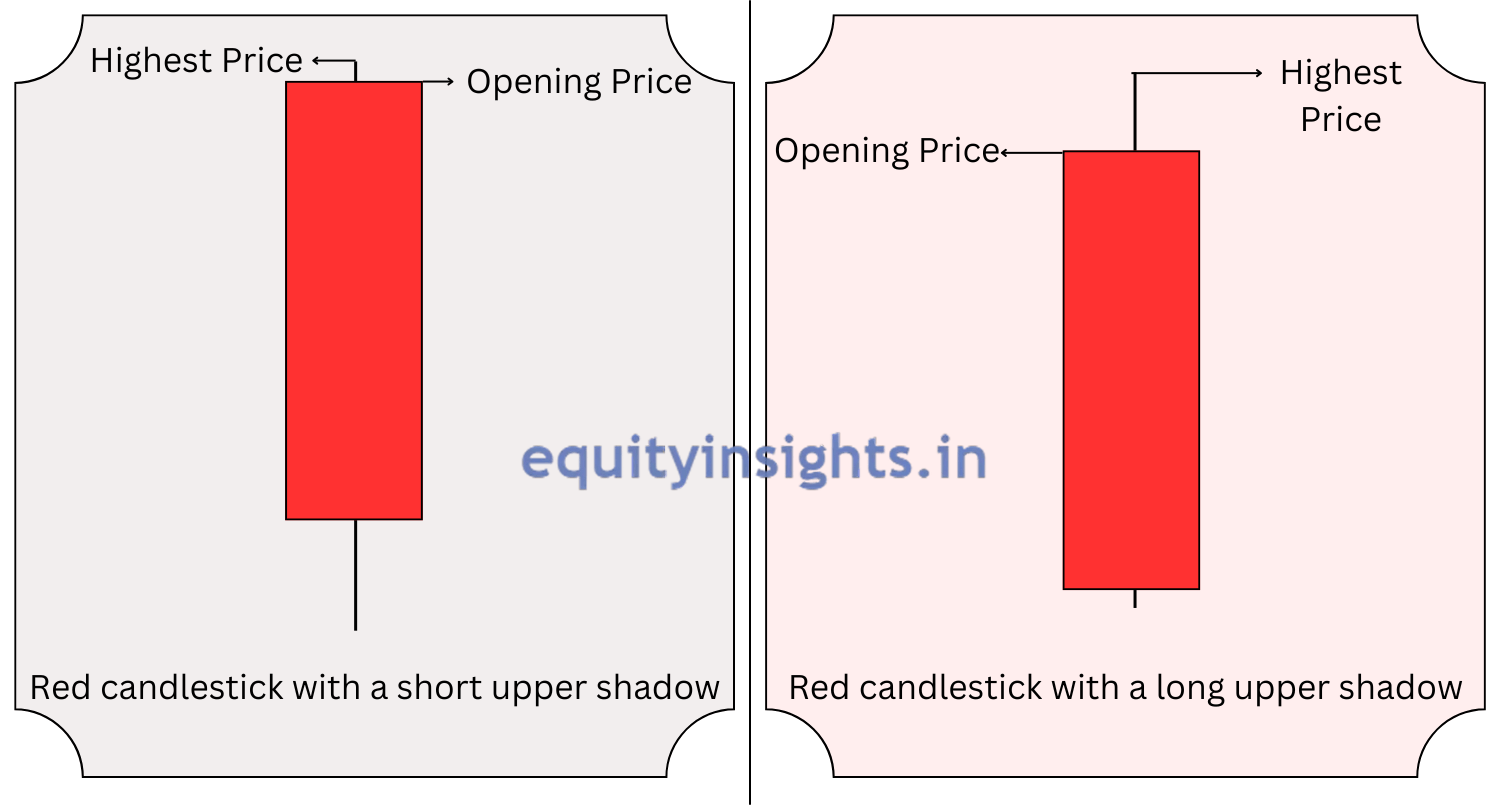
- The red candlestick that has a short upper shadow shows the stock price opened near the high of the day/particular period.
- The red candlestick that has a long upper shadow shows the stock price opened away from its high of the day/particular period.
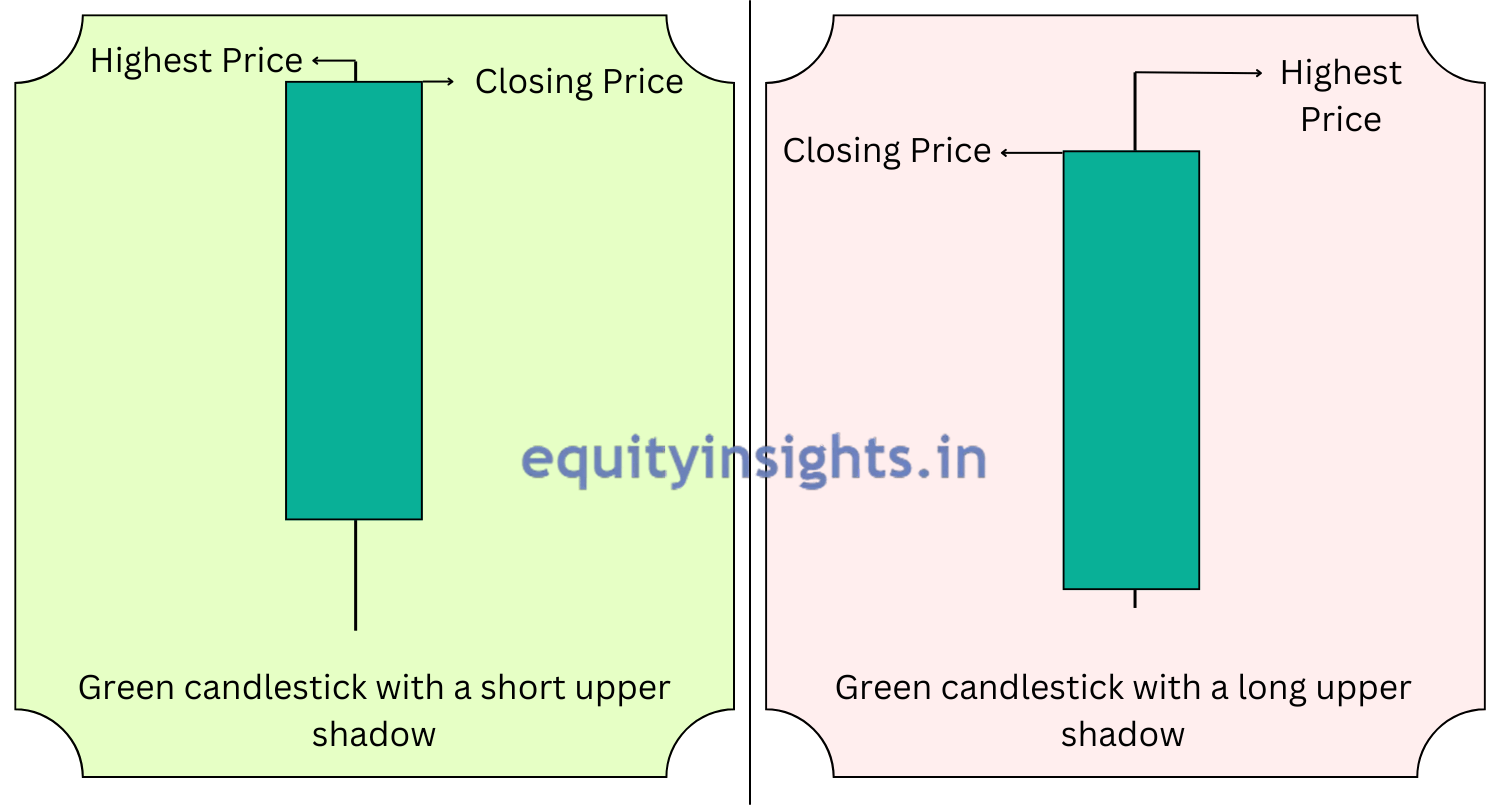
- The green candlestick that has a short upper shadow shows the stock price closed near the high of the day/particular period.
- The green candlestick that has a long upper shadow shows the stock price closed away from the high of the day/particular period.
Each candlestick indicates the market condition and the buy/sell action taking place.
Read More: Trading Economics: How Economic Events Impact Stock Market?
What do Candlestick Patterns tell us?
Candlestick patterns are created by market price swings, both upward and downward. While these price movements may appear random to novice traders, they have significance that may be interpreted using candlestick patterns.
In essence, candlestick patterns depict the ongoing battle between bulls (buyers) and bears (sellers), indicating whether demand or supply for a particular stock is stronger or not. No other charting method depicts this tug-of-war notion among buyers & sellers in the share market as effectively as these Japanese candlesticks do. So, traders use it to decipher market sentiment and to anticipate potential price movements, whether they will rise, fall or remain stable.
Why are Candlestick Patterns Popular?
Now, the question comes what makes the candlestick patterns so popular and widely used tool? The popularity of candlestick patterns lies in its fantastic success rate of about 60-70%, besides its impressive risk-to-reward ratio. It is for such features, that make this tool vital in effective risk management and capital preservation hence making it the most preferred trading tool for technical analysts.
Money/Risk Management for Candlestick Patterns Trade
We all know this thing that no pattern works all the time, as candlestick patterns represent tendencies in price movement, not guarantees. Therefore, even after learning these patterns, the first thing that should be given priority is risk and money management. To follow risk management you need to have a certain set of rules:
- Don’t take a risk of more than 2% in any trade irrespective of how confident you are in the trade.
- Now, as for determining how much loss you can tolerate each day, consider this: if you continuously make a loss for 20 days, even then you should be able to trade on the 21st day with the same amount and quantities without any fear.
- Enter only when your setup is formed on the chart. It means plan your trade and trade your plan on D-day.
These are the three basic rules that every trader should follow in the stock market. However, to learn more about the trading rules, there is a dedicated article on this topic on my website which you can check here: 10 Trading Rules That Make a Trader Successful
Types of Candlestick Patterns
As already discussed above, candlestick patterns are separated into three categories: bullish, bearish and neutral patterns. Bullish patterns indicate a rise in prices while bearish patterns indicate that the price is likely to fall and neutral patterns indicate indecision in the market. Now, these bullish, bearish and neutral candlestick patterns are further categorized into two types:
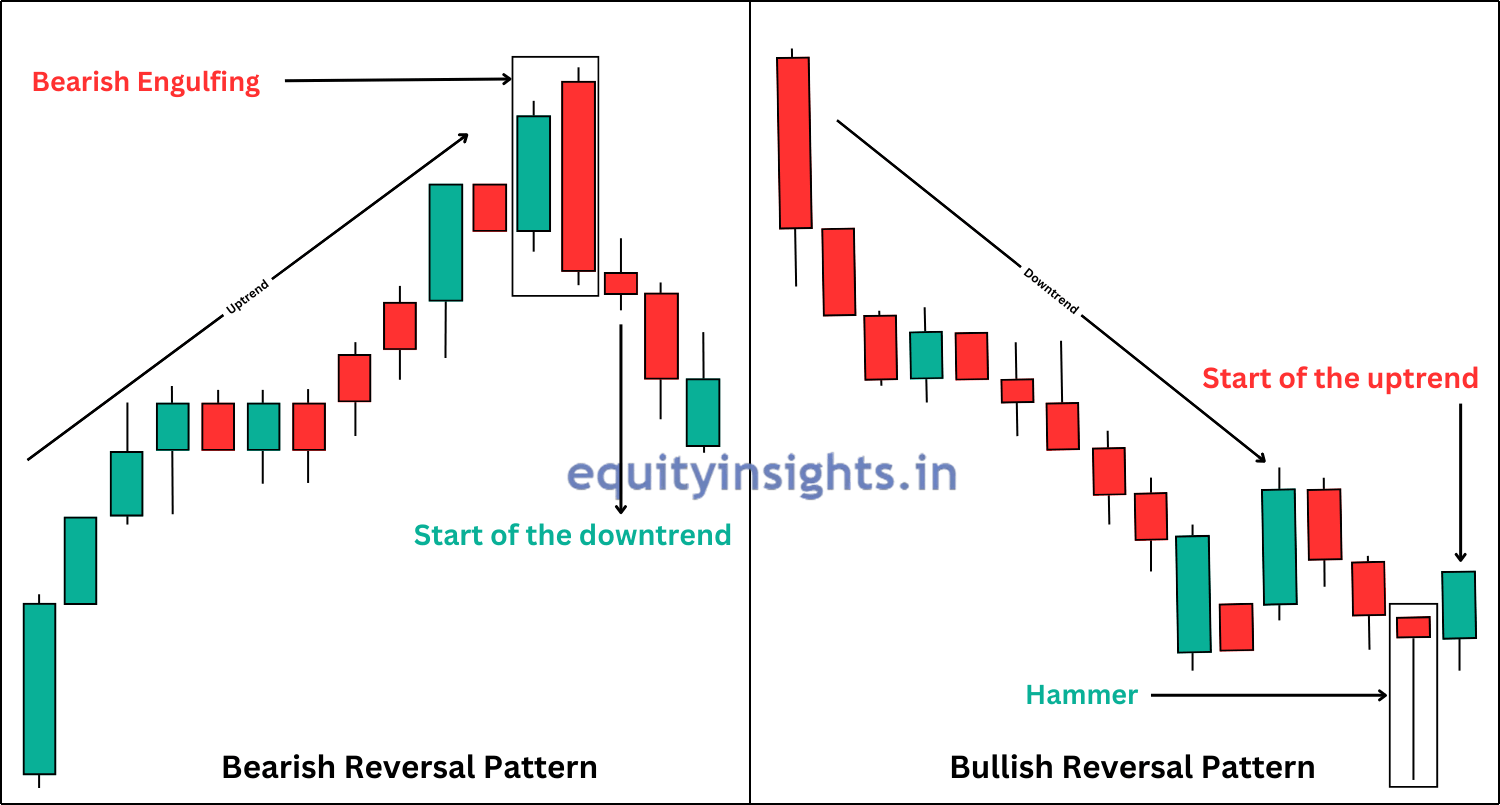
1. Reversal Patterns: Reversal patterns signify a change in the market sentiment where bullish reversal patterns mark a transition from a downward to upward trend, while bearish reversals indicate a move from upward to downward.
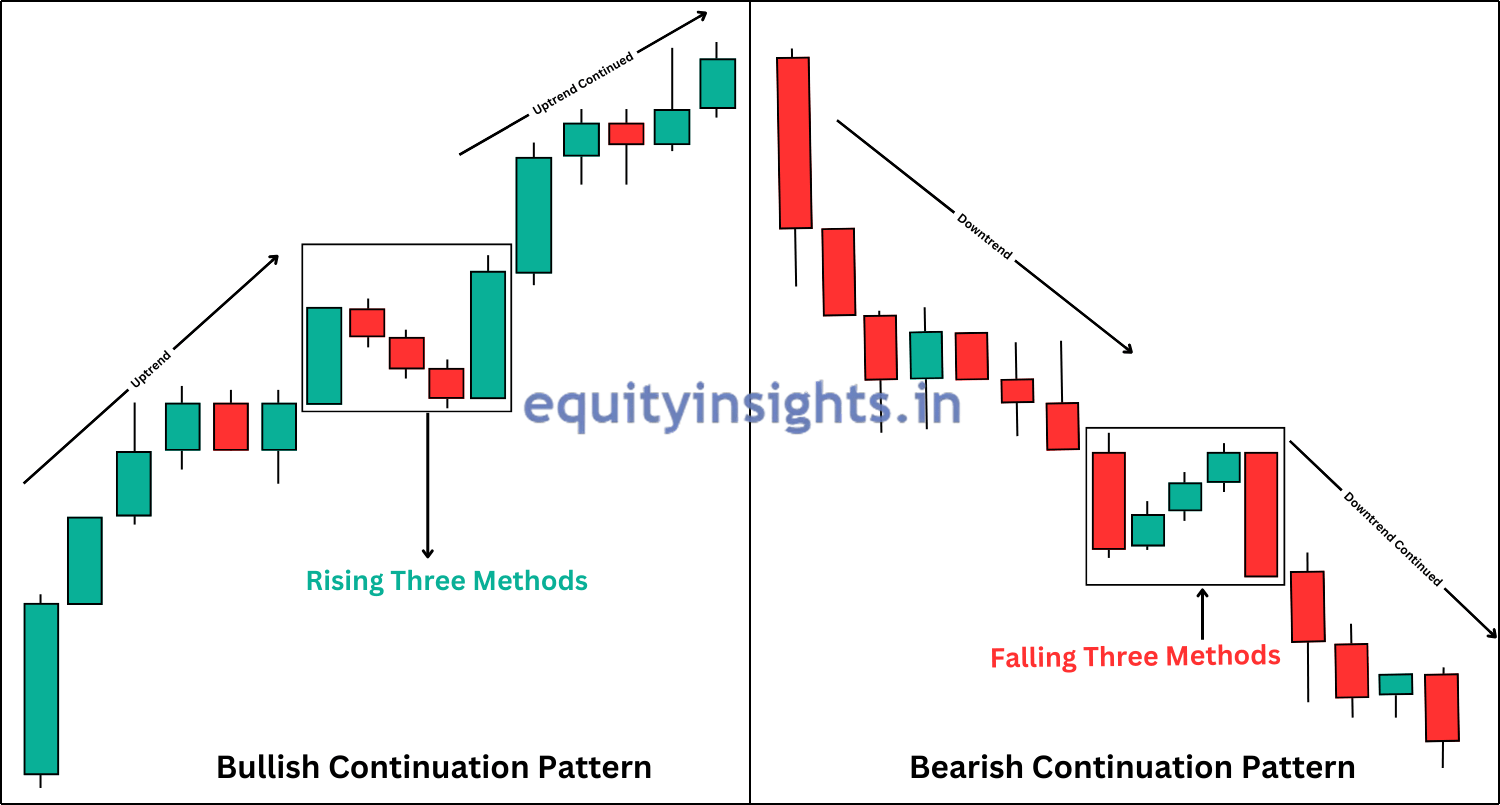
2. Continuation Patterns: Continuation patterns are formations that indicate the prevailing trend in the market—whether upward or downward—is likely to continue after a brief pause or consolidation. These patterns typically appear after a strong price move and suggest that the market is simply “resting” before resuming in the same direction.
Both these reversal and continuation patterns include single candlestick patterns, double candlestick patterns or patterns involving three or more candlesticks.
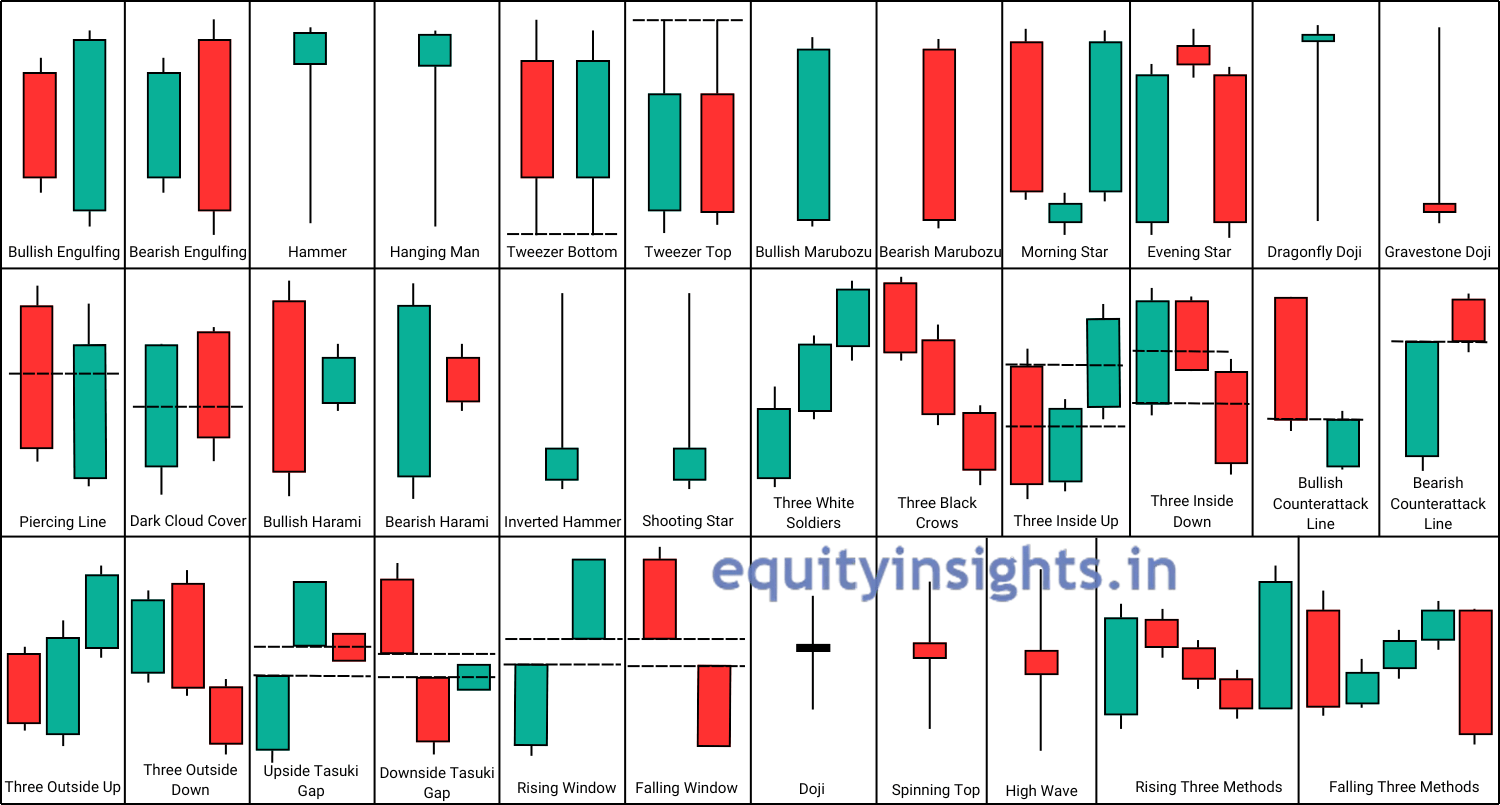
There are about 35 main types of candlestick patterns. Below are details about them all:
Bullish Candlestick Patterns
| Pattern Name | Trend Implications | Characteristics | Description |
|---|---|---|---|
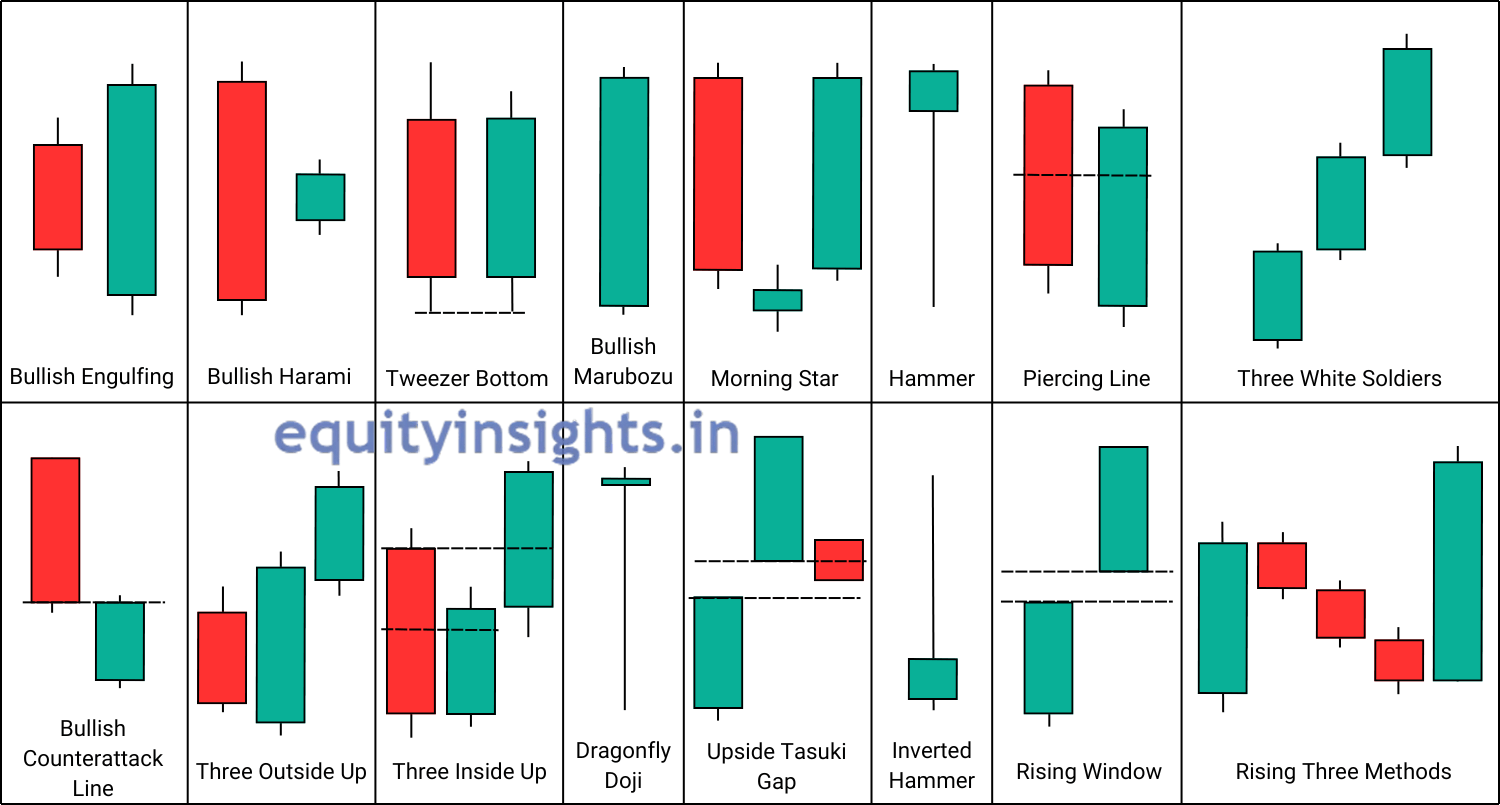
| Bullish Engulfing | Bullish Reversal | A larger bullish candle engulfs the previous smaller bearish candle. | Suggests strong buying momentum, typically appearing after a downtrend. |
| Bullish Harami | Bullish Reversal | A small bullish candle contained within the body of the preceding larger bearish candle. | Indicates slowing bearish momentum, signaling a potential reversal. |
| Tweezer Bottom | Bullish Reversal | Two candles with matching lows, where the first candle is bearish and the second is bullish. | Indicates strong support, signaling a bullish reversal at the bottom of a trend. |
| Bullish Marubozu | Bullish Reversal | A large bullish candle with no wicks or very small wicks. | Represents strong and decisive buying pressure. |
| Morning Star | Bullish Reversal | A three-candle pattern with a bearish, a small indecisive candle and a bullish candle. | Strong signal of a reversal after a downtrend. |
| Hammer | Bullish Reversal | Small body at the top with a long lower shadow and little/no upper shadow. | Appears at the bottom of a downtrend, signaling a potential reversal. |
| Piercing Line | Bullish Reversal | Starts with a bearish candle and is followed by a bullish candle, that opens below the lowest price and closes above the midpoint of the bearish candle. | Suggests buyers regaining control, signaling a potential reversal. |
| Three White Soldiers | Bullish Reversal | Three consecutive bullish candles with higher highs closing prices. | Indicates a reversal with strong buying pressure. |
| Bullish Counterattack Line | Bullish Reversal | A bearish candle followed by a bullish candle with a gap down and a close matching the first candle’s close. | Indicates a potential reversal due to balanced pressure. |
| Three Outside Up | Bullish Reversal | Consists of three candles where bullish engulfing pattern is followed by a bullish candle that opens above the high and closes higher than the second candle’s high. | Indicates slowing bearish momentum with confirmation of a bullish reversal. |
| Three Inside Up | Bullish Reversal | A three-candlestick pattern with a bearish candle, followed by a bullish candle closing above the midpoint of the first, and a final bullish candle closing above the first candle’s close. | Confirms a reversal to the upside after a downtrend. |
| Dragonfly Doji | Bullish Reversal | Open, high and closing prices are nearly equal with a long lower shadow. | Signals a reversal when it appears at the bottom of a downtrend. |
| Upside Tasuki Gap | Bullish Continuation | Two bullish candles with a gap, followed by a small bearish candle closing between the gap. | Indicates continued bullish momentum after a brief pause. |
| Inverted Hammer | Bullish Reversal | A small body at the bottom with a long upper shadow (size of the shadow is 70% and 30% is the real body), little/no lower shadow. | Appears at the bottom of the downtrend, indicating a potential bullish reversal. |
| Rising Window | Bullish Continuation | A gap between the high of the first candle and the low of the second candle. | Suggests strong bullish sentiment and potential continuation. |
| Rising Three Methods | Bullish Continuation | A large green candle, followed by three small red candles that don’t surpass its high if formed, and at last ends with another big green candle closing above all. | Confirms the continuation of an uptrend. |
Bearish Candlestick Patterns
| Pattern Name | Trend Implications | Characteristics | Description |
|---|---|---|---|
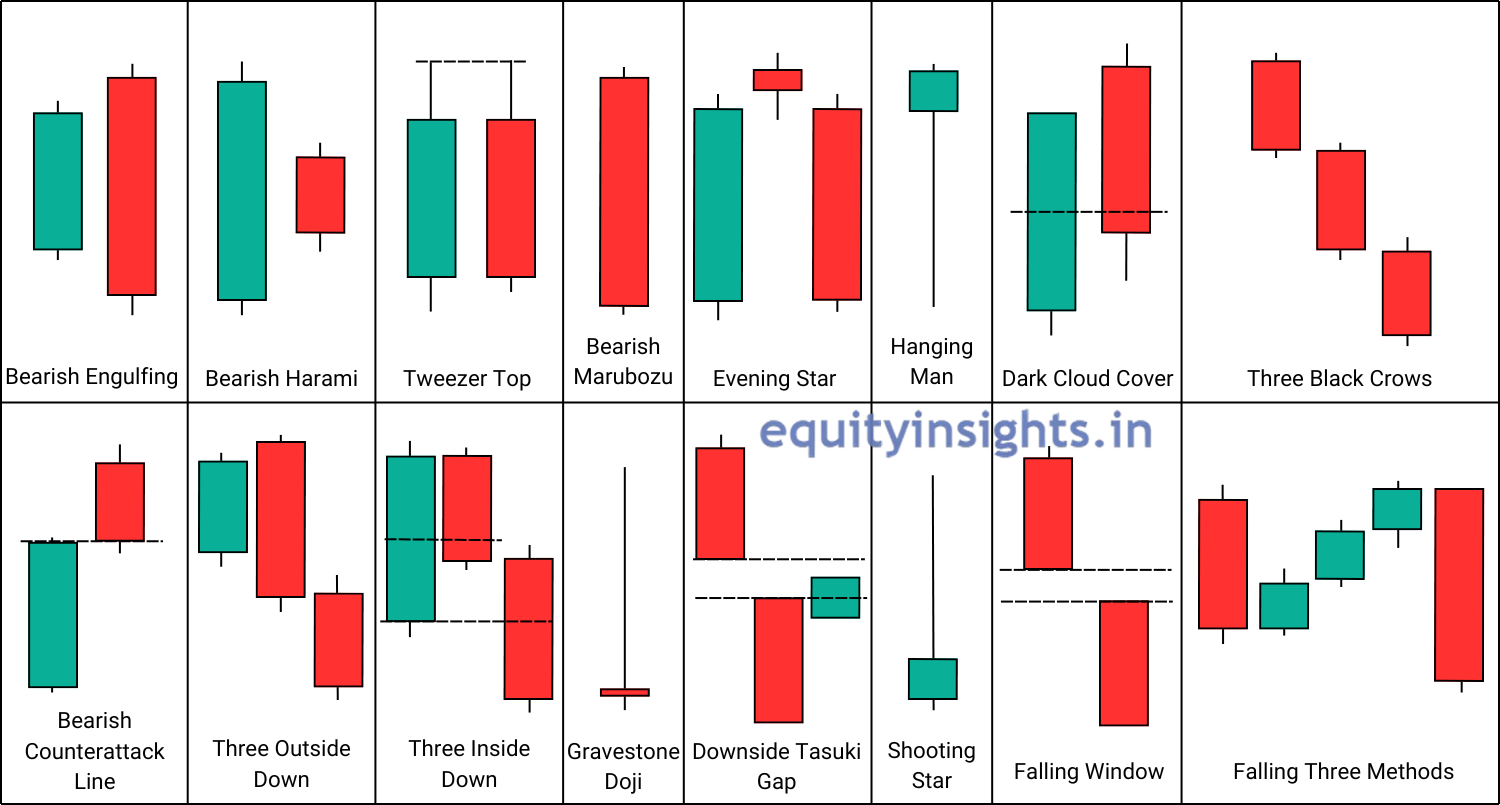
| Bearish Engulfing | Bearish Reversal | A larger bearish candle engulfs the previous smaller bullish candle. | Suggests strong selling pressure, typically appearing after an uptrend. |
| Bearish Harami | Bearish Reversal | A small bearish candle contained within the body of the previous larger bullish candle. | Indicates slowing bullish momentum, signaling a potential reversal. |
| Tweezer Top | Bearish Reversal | Two candles with matching highs where the first candle is bullish and the second is bearish. | Indicates strong resistance, signaling a bearish reversal at the top of a trend. |
| Bearish Marubozu | Bearish Reversal | A large bearish candle with no wicks or very small wicks. | Represents strong and decisive selling pressure. |
| Evening Star | Bearish Reversal | A three-candle pattern with a bullish, a small indecisive candle and a bearish candle. | Strong signal of a reversal after an uptrend. |
| Hanging Man | Bearish Reversal | Small body with a long lower shadow and little/no upper shadow. | Looks similar to Hammer but appears at the top of an uptrend, signaling a potential reversal. |
| Dark Cloud Cover | Bearish Reversal | Starts with a bullish candle and is followed by a bearish candle, that opens above the highest price and closes below the midpoint of the bullish candle. | Suggests sellers regaining control, signaling a potential reversal. |
| Three Black Crows | Bearish Reversal | Three consecutive bearish candles with lower closing prices. | Strong reversal signal indicating a sustained bearish trend. |
| Bearish Counterattack Line | Bearish Reversal | A bullish candle followed by a bearish candle with a gap up and a close matching the previous candle’s close. | Indicates a potential reversal due to balanced pressure. |
| Three Outside Down | Bearish Reversal | Consists of three candles where the bearish engulfing pattern is followed by a bearish candle that opens below the low and closes lower than the second candle’s low. | Indicates slowing bullish momentum with confirmation of a bearish reversal. |
| Three Inside Down | Bearish Reversal | A three-candlestick pattern with the first one a bullish candle, followed by a bearish candle closing below the midpoint of the first, and a final bearish candle closing below the first candle’s close. | Confirms a reversal to the downside after an uptrend. |
| Gravestone Doji | Bearish Reversal | This pattern is characterized by nearly identical opening and closing prices, along with a long upper wick and no lower or minimal wick. | Signals a reversal when it appears at the top of an uptrend. |
| Downside Tasuki Gap | Bearish Continuation | Two bearish candles with a gap, followed by a small bullish candle closing between the gap. | Indicates continued bearish momentum after a brief pause. |
| Shooting Star | Bearish Reversal | Small body with a long upper shadow (size of the wick is 70% and 30% is the real body), little/no lower shadow. | Looks similar to an inverted hammer but appears at the top of an uptrend, signaling a potential bearish reversal. |
| Falling Window | Bearish Continuation | A gap between the low of the first candle and the high of the next. | Suggests a strong bearish sentiment and potential continuation. |
| Falling Three Methods | Bearish Continuation | A large bearish candle, followed by three small bullish candles that don’t cross its low if formed and at last comes another big bearish candle closing below all. | Confirms the continuation of a downtrend. |
Neutral Candlestick Patterns
| Pattern Name | Trend Implications | Characteristics | Description |
|---|---|---|---|
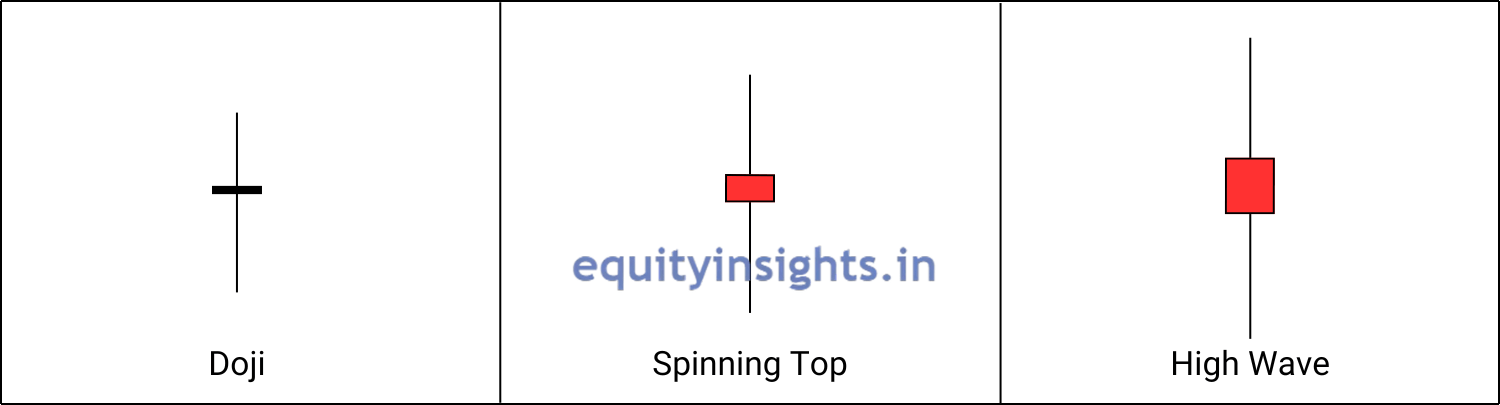
| Doji | Neutral (Reversal or Continuation) | Open and close prices are nearly the same, forming a cross-like shape. | Signals indecision in the market; the trend implication depends on the context (uptrend, downtrend or consolidation). |
| Spinning Top | Neutral (Reversal or Continuation) | Small real body with long upper and lower shadows. | Represents indecision, suggesting that neither buyers nor sellers are in full control. |
| High Wave | Neutral (Reversal or Continuation) | A candlestick with a small body and longer upper and lower shadows compared to the Spinning Top. | Indicates significant market indecision, often appearing before a reversal or continuation. |
So, that wraps up 35 candlestick patterns. Candlestick patterns have proven to be an invaluable tool in the world of technical analysis, providing traders with critical insights into market sentiment and potential price movements. With a rich history dating back to 18th century Japan, these patterns have evolved to become a cornerstone of trading strategies across the globe. By understanding the various types of candlestick patterns—whether bullish, bearish, or neutral—traders can better interpret market behaviour and make more informed decisions. From identifying trend reversals to recognizing continuation signals, mastering candlestick patterns empowers traders to navigate the complexities of the stock market with confidence and precision.
Whether you’re a beginner or a seasoned trader, these patterns remain an essential part of any effective trading toolkit. This is it from my side in this article. Now, tell me in the comments which pattern from this entire list, you like the most? Do share with your friend circle. I will see you in the next article. Until then, take care and happy trading!
Disclaimer: The information provided in this article is intended solely for educational, illustrative and awareness purposes. Nothing contained herein should be construed as a recommendation. Users are encouraged to seek professional financial advice before making any decisions based on the content provided.
FAQs
Q1. Is candlestick pattern analysis effective?
Yes, the candlestick pattern analysis is the most effective way to interpret and predict the movement of the market. 25 most commonly used candlestick patterns help predict market movements 90 percent of the time. The efficiency of each candlestick pattern can be improved by using other technical tools and considering more variables.
Q2. Do the candlestick patterns work?
Yes, the candlestick patterns do work. The greatest evidence that it works, is in their relevance to this day. These patterns are being used since 18th century and is one of the oldest methods for analyzing and it is still used by traders.
Q3. How many types of candlestick patterns are there?
While there are over 40 candlestick patterns, not all of them deliver consistent results. That’s why this article focused on the 35 key patterns that are known for their stronger success rates.
Q4. What are the most powerful single, double and more than two candlestick patterns?
The most powerful single candlestick patterns include the Bullish Marubozu and Hammer for bullish signals, while the Bearish Marubozu and Hanging Man are key indicators for bearish trends. Among double candlestick patterns, Bearish Engulfing, Bearish Harami and Tweezer Top suggest a potential downtrend while Bullish Engulfing, Bullish Harami and Tweezer Bottom point to a possible uptrend. For patterns involving more than two candlesticks, the Morning Star and Evening Star are highly regarded for their strength in predicting market reversals.
Q5. What is the difference between Spinning Top and High Wave candlestick patterns?
The High Wave has longer shadows compared to the Spinning Top, reflecting more significant volatility within the trading session. The Spinning Top typically has smaller body sizes and is a more common sign of indecision, while the High Wave suggests extreme indecision with pronounced price swings. Both patterns signal indecision, but the High Wave generally suggests a more volatile or uncertain market environment.