

Hello, friends! Have you ever wondered how some traders capitalize on explosive stock movements and generate significant profits while managing risks effectively? The secret lies in breakout stocks—stocks that break through key resistance levels and set the stage for powerful price surges. But are breakout stocks truly a golden opportunity or do they come with hidden risks? More importantly, how can you spot them early and make the most of their potential?
In this article, we’ll dive deep into breakout stocks, uncovering how they work, how to identify them and whether they fit into your trading strategy. Can these stocks revolutionize the way you invest? Let’s explore and find out!
Table of Contents
What are Breakout Stocks?
At some point in your trading journey, you’ve likely heard about breakout stocks—whether on TV, news channels, YouTube or through your friends and acquaintances. You may have come across discussions about a particular stock being on the verge of a major breakout, indicating a potential sharp price surge or in some cases, a significant downtrend based on technical patterns. You may have come across statements like, “Tata, Adani or Cipla shares experienced a breakout, leading to a significant price surge,” or “A breakout is expected in Tata shares in the near future, which could result in a substantial price increase.”
Breakout stocks refer to stocks that move beyond a significant resistance or support level with increased volume, signaling the potential for further price movement in the breakout direction. A breakout signifies that a stock has broken through its previous resistance, indicating the potential for further growth. Such stocks often attract strong interest from traders and investors, as they signal momentum and possible upward movement.
Also Read: Sensex Historical Data: Sectors that can Outperform in 2025
When does a Breakout happen?
A breakout happens when a stock’s price makes a sudden and decisive move, influenced by internal factors, external events, historical price trends or technical indicators. This can either propel the stock upward, breaking past resistance or send it downward, falling below support.
Simply put, when a stock rebounds from a correction and surges past a resistance level, it’s called a breakout. Conversely, if it breaks below a support level after a correction, it’s known as a breakdown. Recognizing these movements early can help traders seize high-potential opportunities while managing risk effectively.
Why does a Breakout happen in the Stock Market?
Breakouts occur due to a surge in buying or selling activity, often triggered by fundamental events (e.g. earnings reports, mergers, acquisitions, economic news) or technical setups (e.g. chart patterns, moving average crossovers) and on top of this when a stock surpasses key levels, traders and investors jump in, further fueling the movement.
Read More: Zaggle Prepaid Share: A Promising Investment or Risky Bet?
Why do Traders Prefer Breakout Stocks?
Market participants always look for high-potential opportunities that offer better returns. New investors often make the mistake of investing in slow-moving stocks, which take months or even years to show significant growth. As a result, their money gets stuck in underperforming stocks, leading to frustration and lower returns.
To avoid this, many traders prefer stocks with strong price movements that follow a cyclic pattern and tend to break out at regular intervals, providing trading opportunities with higher potential profits in short duration. Breakout stocks typically provide an average return of around 10%-15% within a period of 2 weeks to 6 months. This is why they focus on breakout stocks as it is a significant benefit for investors, which allows them to earn returns without the need for constant effort, repeatedly selecting stocks or frequently monitoring the market, all while managing their tasks.
What is a Breakout Trading?
Breakout trading or breakout strategy refers to a trading style where a trader buys or sells a financial security, once it breaks an important support or resistance level. In a breakout trading strategy, traders identify financial securities that have been trading in range or consolidating for a while, then they mark key support and resistance levels along with trend lines to identify potential breakouts.
In breakout trading strategy, one may use indicators such as moving averages and also study candlestick patterns that can help in gauging the direction of the breakout. Traders can also pay close attention to the volume of the security to confirm the breakout.
Breakout trading can be applied to various assets such as stocks, indices, commodities and currencies. Let’s look at an example of a breakout trade: Imagine a stock, ABC, which experienced a strong rally from ₹50 to ₹100. However, for the past few months, it has been trading within a tight range between ₹100 (support) and ₹110 (resistance). A savvy trader notices this consolidation phase and marks these key levels on the chart. The stock continues to hover within this range until, finally, it breaks above ₹110 with strong momentum.
Before jumping into the trade, the trader confirms the breakout by analyzing the trading volume or any other tool that he uses for confirmation which can include candlestick patterns or technical indicators too. It is a crucial factor in determining whether the breakout is genuine or false. Once convinced, the trader enters a long position and strategically sets a stop loss to manage risk. As expected, the breakout proves successful and the stock surges from ₹110 to ₹150, hitting the trader’s profit target. This well-executed trade demonstrates the power of breakout trading when combined with technical analysis and proper risk management.
This strategy can also be applied when a trader anticipates a downward price movement in a stock. In such cases, instead of a breakout, the trader looks for a breakdown, where the price falls below a key support level, signaling a potential decline. This approach is known as the Breakdown Strategy.
Also Read: Candlestick Patterns: Definition, History and Its Types
Advantages/Benefits of Breakout Stocks or Breakout Trading

If you can identify a breakout at the right time, you can earn significant profits. Breakout trading offers several advantages, which are listed below:
- Higher Profit Potential: Traders can make substantial profits from a single trade when trading breakout stocks.
- Controlled Risk: Breakout trading carries lower risk since traders set tight stop loss levels to limit losses from false breakouts. If the stop loss is hit, they can often repurchase the stock at a lower price, minimizing overall losses. This approach provides traders with a clear understanding of potential risks, helping to prevent sudden capital depletion.
- Momentum Trading & Quick Profit Potential: Breakout stocks attract traders who want to capitalize on price movements for quick gains. Breakout stocks experience a gradual build-up of momentum before making a sharp move up or down. Their growth efficiency depends on the technical indicators and strategies used. For example, if you use the 200 EMA (200-day Exponential Moving Average), your growth rate can be around 15%-20% in 4-6 months with minimal risk.
- More Profit Opportunities: Breakout trading generally provides higher chances of profitability.
- Predictability Based on Historical Movements: Breakout stocks often follow historical price movements, making accurate predictions possible.
- Easy to Understand: Breakout trading is easy to understand and implement with predetermined criteria that need to be met. As a result, breakout stock trading is suitable for beginners as well as experienced traders.
- Suitability: Breakout strategies are suitable for various asset classes. A trader can identify breakout patterns and enter into trades across stocks, indices, commodities, or currencies.
The biggest advantage of trading in breakout stocks is that investors have the opportunity to earn good profits in a short period as breakout stocks often experience rapid price movements immediately after a breakout, making them a preferred choice for traders. However, many investors enter the stock market without proper knowledge, leading to impulsive decisions and financial losses. Studies suggest that around 95% of uninformed investors face losses. To overcome this challenge, traders use various indicators and adopt a simple yet effective strategy for investing in breakout stocks.
Disadvantages of Breakout Trading/Risks Associated with the Breakout Trading

While breakout stocks offer several opportunities for traders, if not handled with discipline, they can also lead to significant losses. Here are some of the risks associated with trading breakout stocks:
- Failure to Capture the Breakout: If you fail to identify the breakout correctly, it can turn against you, leading to losses. Precision plays a vital role in breakout trading.
- Timing Issues: Timing plays a critical role in breakout trading. If you fail to enter the trade at the right moment, it can reduce your profits significantly.
- Intraday Trading Risks: If you’re looking to make quick gains from breakout stocks, avoid intraday trading. Large players often use breakouts for intraday strategies, reversing their positions to trigger your stop loss, causing you to lose money.
- Uncertainty of Breakout: One of the key disadvantages of breakout trading is that breakouts may fail. In the stock market, no breakout can be 100% guaranteed. While we can anticipate breakouts, their success is never certain.
- False/Fake Breakouts: One of the most common pitfalls in breakout trading is encountering fake breakouts. Many stocks give a false impression of breaking out, only to reverse, trapping traders and causing losses.
- High Volatility: Breakout stocks are often highly volatile. If your trade goes against you, the sudden price swings can lead to substantial losses. Using calculated stop losses is essential to manage this risk.
- Overvaluation: Entering a stock too late after it has already broken out can be risky. At such times, the stock may be overvalued, leading to a potential price drop.
- Lack of Fundamental Support: Sometimes, a stock may break out due to technical factors or market sentiment, but if its fundamentals are weak, the price may quickly reverse. Fundamental analysis is as important as technical indicators.
- Market Conditions: Breakout stocks are highly sensitive to market conditions and sentiment. A sudden shift in market sentiment or economic conditions can dramatically impact the success of a breakout.
- Emotional Bias: While trading keeping emotions aside is vital. In breakout trading, it is important to have a grip over your emotions to prevent any early entry or any impulsive trades.
While breakout stocks can be tempting, traders must approach them with caution using disciplined strategies to manage these risks effectively. Always analyze the stock’s fundamentals, market conditions and timing before entering a trade.
Also Read: The Psychology of Money: Key to Stock Market Success
Types of Breakouts in the Stock Market
To get the maximum advantage from the breakout stocks, it becomes important to understand the different types of breakouts. So, the two main types of breakouts are:
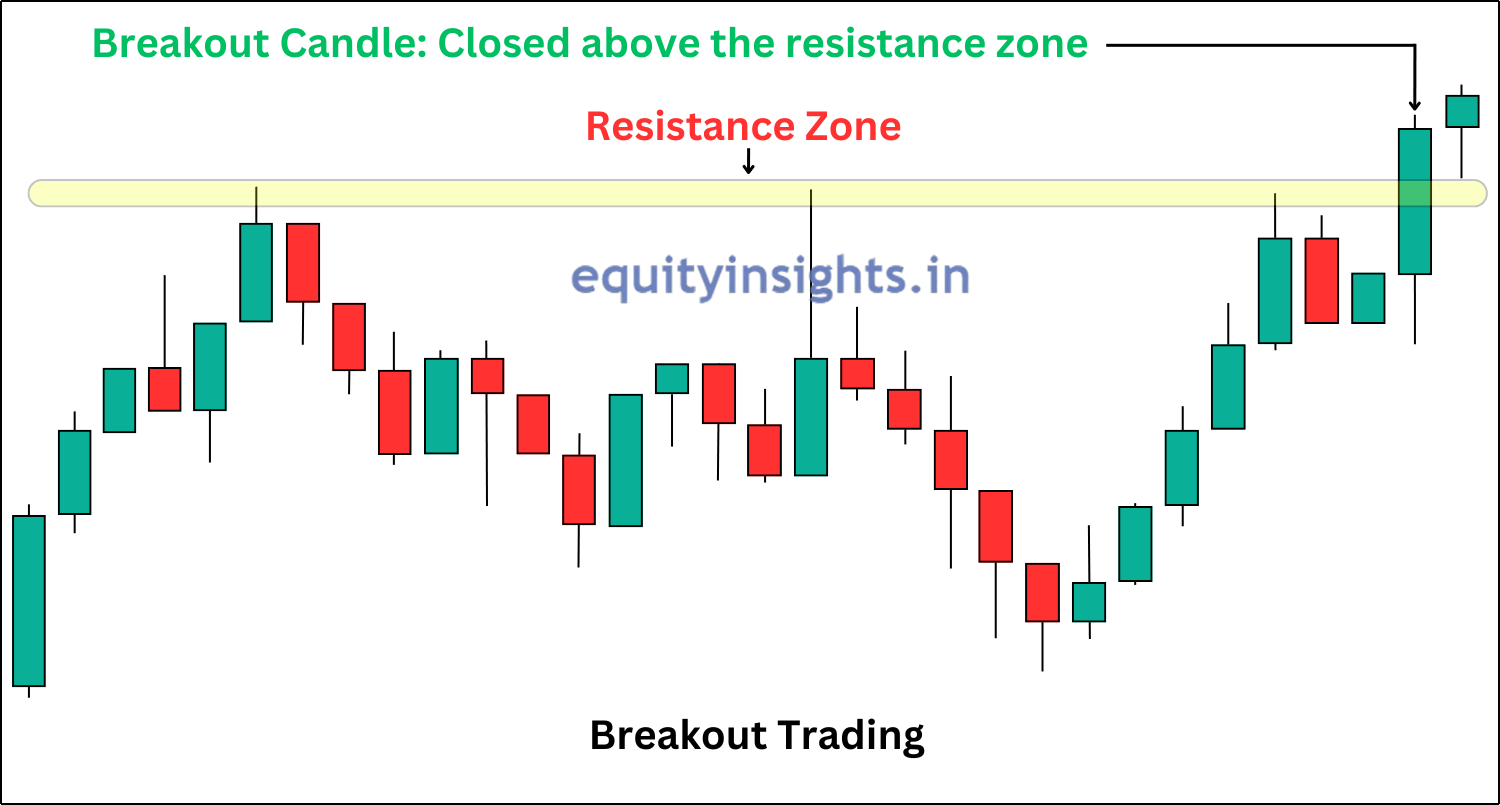
1. Resistance Breakout: Resistance breakout occurs when a stock price moves above a well-defined resistance level, indicating bullish momentum and potential for further gains. This is the breakout that traders go for in order to fetch the maximum profit in a single trade.
The resistance breakout is itself divided into two parts:
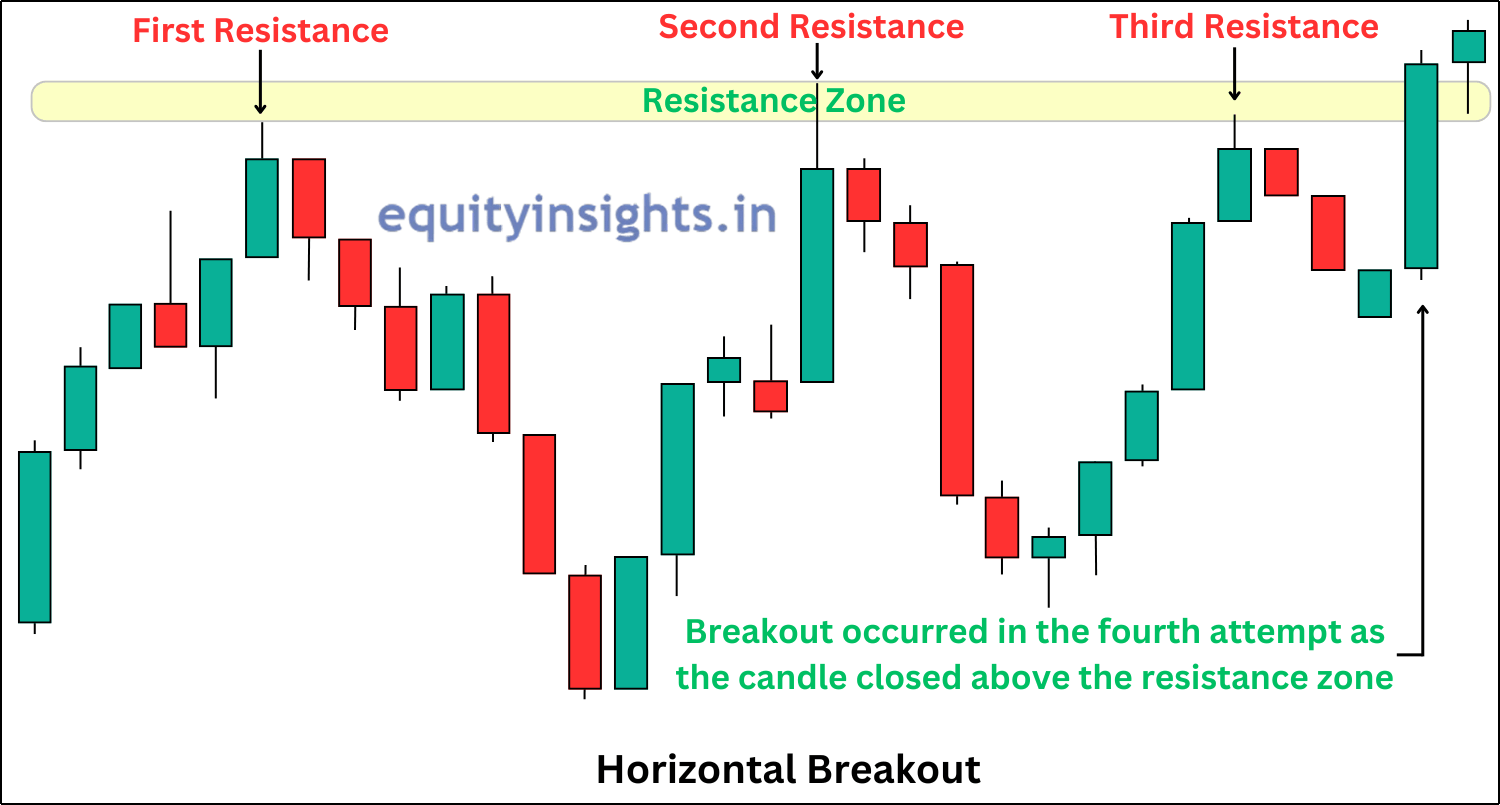
- Horizontal Breakout: A horizontal breakout takes place when the price of a security has been trading within a range and the breakout ends the consolidation period, after which the price moves significantly in an upward direction.
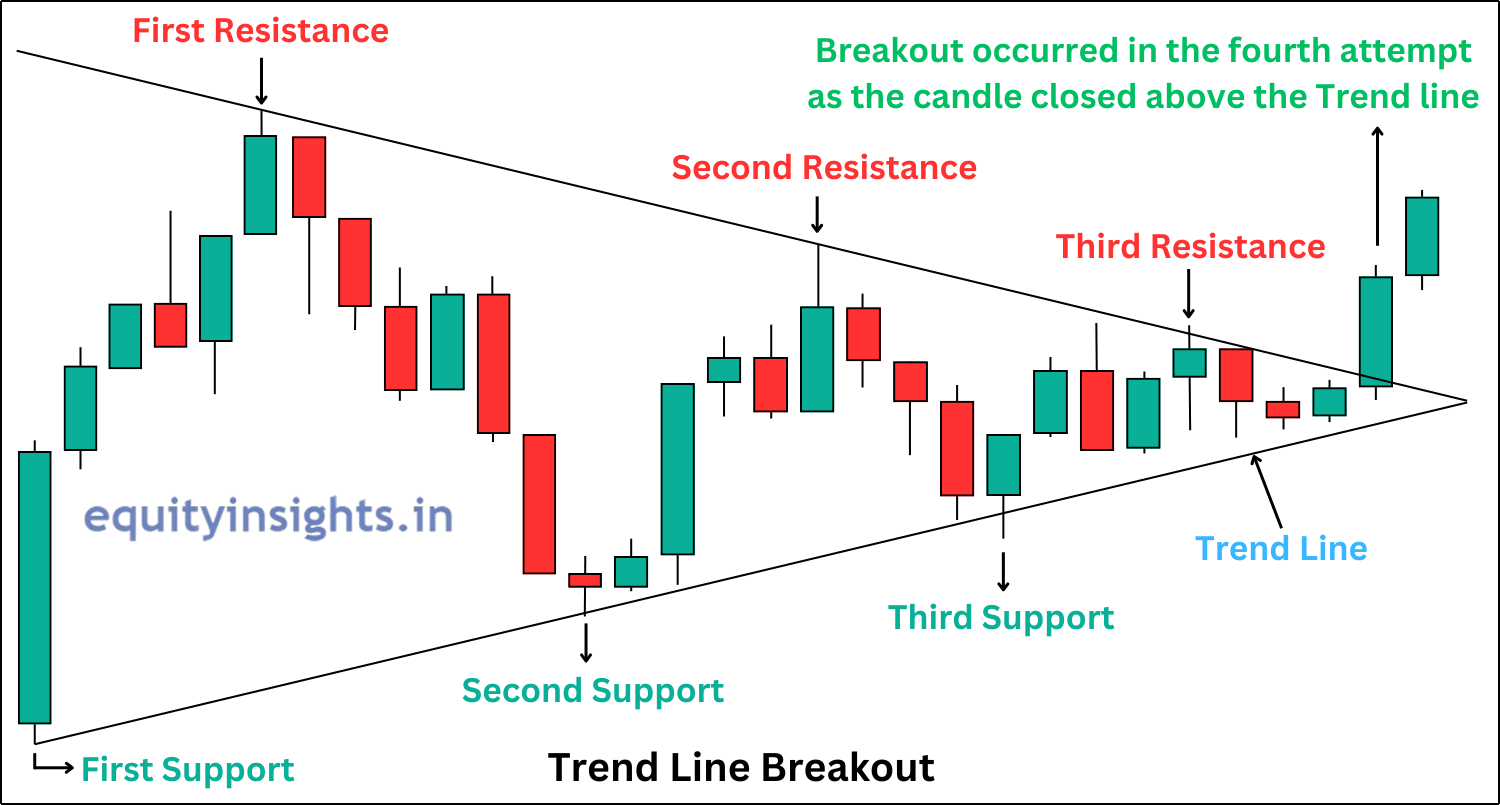
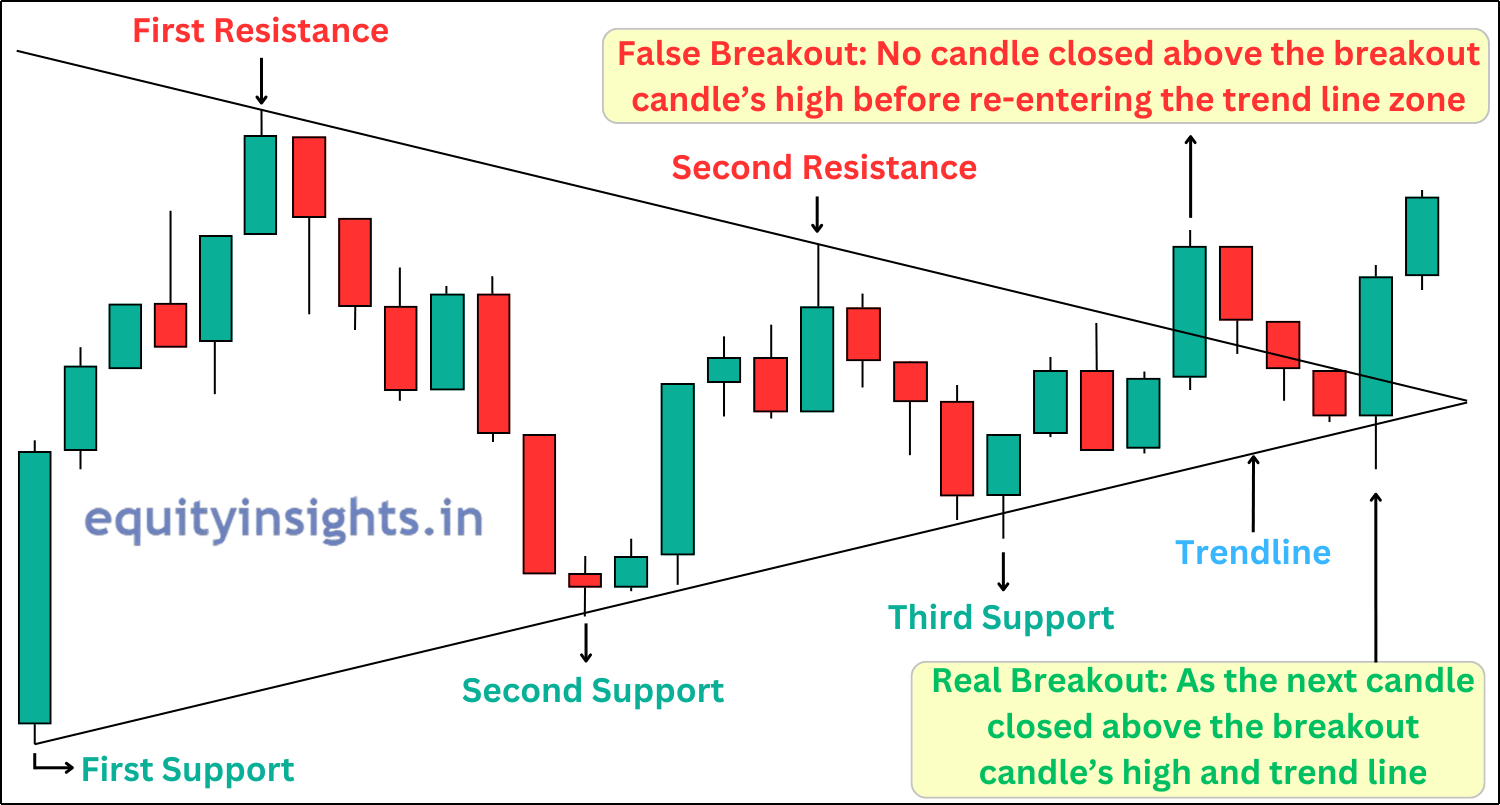
- Trend Line Breakout: A trend line is used to mark the prevalent trend of security by connecting the highs or the lows. A price may often take support or face resistance at the trend line. If the price gives a breakout, it signals a reversal of the ongoing trend.
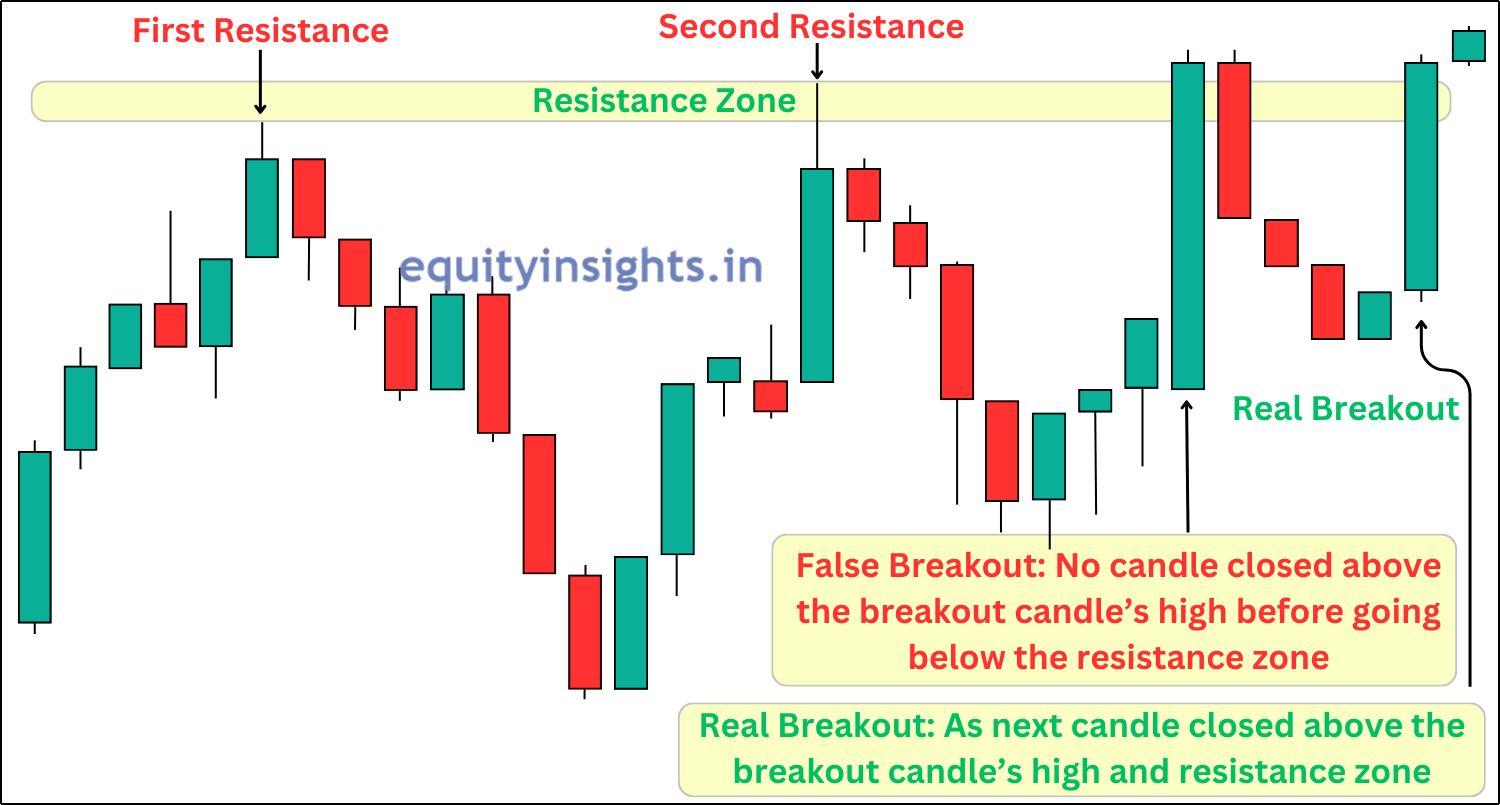
2. False/Fake Breakouts: As the name itself suggests that this breakout is something that a trader stay away from as it is a temporary move beyond a key level that quickly reverses, trapping traders who entered prematurely. Identifying false breakouts is crucial to avoid unnecessary losses. To identify the false or fake breakouts, you can either take the help of technical indicators like volume at the time of breakout or check if the candle next to the breakout candle closes above its high.
How to Find Breakout Stocks?
Every trader and investor is on the lookout for stocks that can deliver massive returns in a short time. To achieve this, they seek out breakout stocks—stocks that are expected to show high volatility and sharp price movements. Identifying such stocks requires a blend of technical analysis, fundamental analysis and market sentiment evaluation. Below are the essential strategies for identifying breakout stocks:
1. Use Technical Analysis to Spot Breakout Signals: Many traders rely on technical indicators to find breakout stocks. Here’s what technical indicators you can use to find the breakout stocks:
- Chart Patterns: You can look for breakout signals through formations like Triangles, Flags, Pennants and Cup-and-Handle patterns. These patterns indicate a potential strong price movement.
- Moving Averages: Simple yet powerful indicators like 50 EMA and 200 EMA help identify stocks ready for a breakout, especially when the price crosses these levels.
- Volume Analysis: Breakouts with high trading volume are more reliable. A significant increase in volume often confirms the breakout’s strength.
- Support & Resistance Levels: Many traders draw trend lines to mark key support and resistance zones—a breakout beyond these levels indicates a strong price move. So, it is another important tool in technical analysis that you must use to understand the price action in a stock.
2. Fundamental Analysis to Evaluate Strong Stocks: Apart from technicals, strong fundamentals help confirm the sustainability of breakouts. You must check the following things in a stock that you have filtered out for trading in case of a breakout:
- Company Performance: Analyze the company’s financial health, earnings reports, industry trends and growth potential to ensure you’re picking fundamentally strong breakout stocks.
- Catalysts: Certain events act as triggers for breakouts, such as:
- New product launches
- Earnings surprises
- Positive guidance
- Industry developments
Essentially, you should focus on fundamentally strong stocks with high liquidity, ensuring they can’t be easily manipulated by low-volume trades.
3. Use Screening Tools to Find Breakout Stocks: Using screening platforms can simplify the search for breakout stocks. These tools allow traders to filter stocks based on price volatility, volume, technical indicators and fundamental metrics. For Technical analysis, you can utilize TradingView, while for Fundamental analysis, Screener is a great tool to rely on.
4. Keeping an Eye on Market Sentiment & Trends:
- News & Social Media: Monitoring stock market news and investor discussions can help in identifying potential breakouts early.
- Price to Earning Ratio (P/E): Compare a stock’s P/E ratio with its sector and the broader market. If the stock’s P/E ratio is higher than its peers but lower than the sector’s P/E, it could indicate a strong breakout opportunity.
5. Historical Analysis: Avoid false breakouts by back-testing breakout patterns on historical stock data. This helps refine strategies and improve entry timing.
These were the five key factors to help you identify breakout stocks. A detailed guide on spotting breakouts will be covered in upcoming articles.
Also Read: 10 Trading Rules That Make a Trader Successful
Breakout Stocks Trading Strategies
As discussed above breakout trading is one of the most effective strategies for capturing big price moves in stocks. Below is the list of different breakout strategies that can be used in the trading. I’ll be diving deep into all these breakout trading strategies in the upcoming articles, helping you identify high-potential stocks across different time frames and technical indicators.
Breakout Strategies Based on Time Frames
- 52-Week High Breakout Stocks Strategy – Capitalizing on stocks hitting fresh yearly highs.
- All-Time High Breakout Stocks Strategy – Trading stocks that reach their highest price ever.
- 15-Minute Breakout Stocks Strategy – Quick intraday trades based on short-term price movements.
- Multiyear Breakout Stocks Strategy – Identifying long-term breakout opportunities.
- Weekly Breakout Stocks Strategy – Trading stocks with strong weekly breakout patterns.
- Monthly Breakout Stocks Strategy – Capturing momentum on a monthly time frame.
Breakout Strategies Based on Indicators
- 50 EMA Breakout Stocks Strategy – Trading stocks that break above the 50-day Exponential Moving Average.
- 200 EMA Breakout Stocks Strategy – Identifying strong uptrends using the 200-day EMA.
Chart Patterns That Signal a Breakout & Breakout Strategies Based on These Patterns
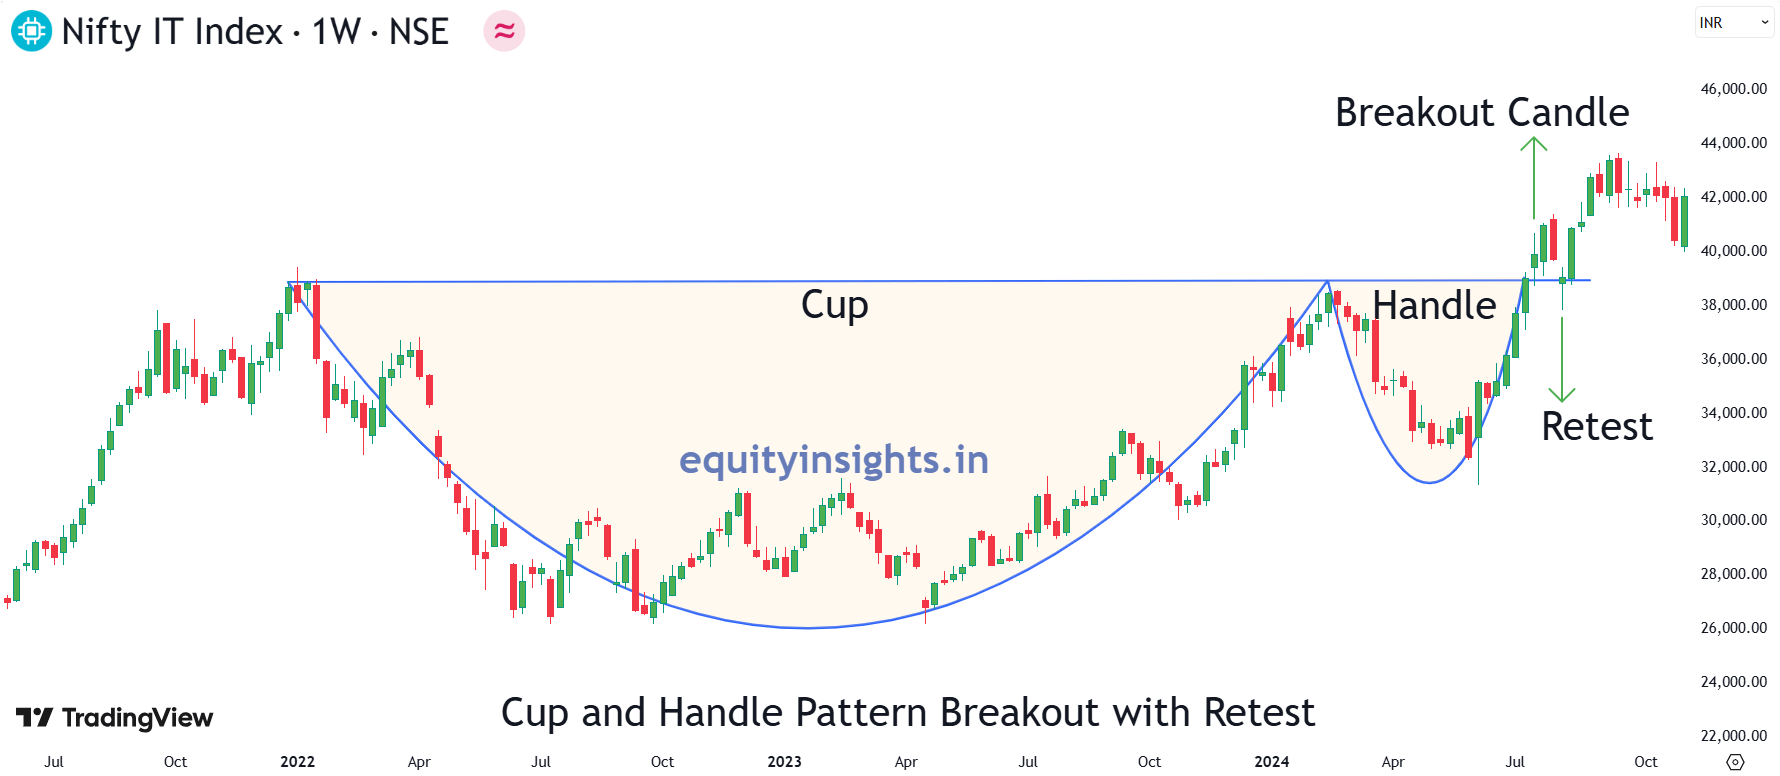
1. Cup and Handle Pattern: The cup and handle pattern is a technical chart formation commonly used in stock trading, typically signaling a potential bullish continuation. It consists of two main parts: the cup and the handle.
- Cup: The “cup” part of the pattern resembles a rounded “U” shape, which typically takes several weeks or months to form. It starts with a price decline, followed by a gradual upward trend, forming a rounded bottom and a return to near the previous high. The cup reflects a consolidation phase, where the stock’s price pulls back and then recovers, showing a balance between supply and demand.
- Handle: After the cup is formed, a smaller consolidation or pullback occurs, which is the “handle.” The handle typically forms on the right side of the cup and appears as a slightly downward or sideways price movement. This consolidation indicates that the stock is taking a brief rest before resuming its upward trend. Ideally, the handle should not dip below the top of the left side of the cup.
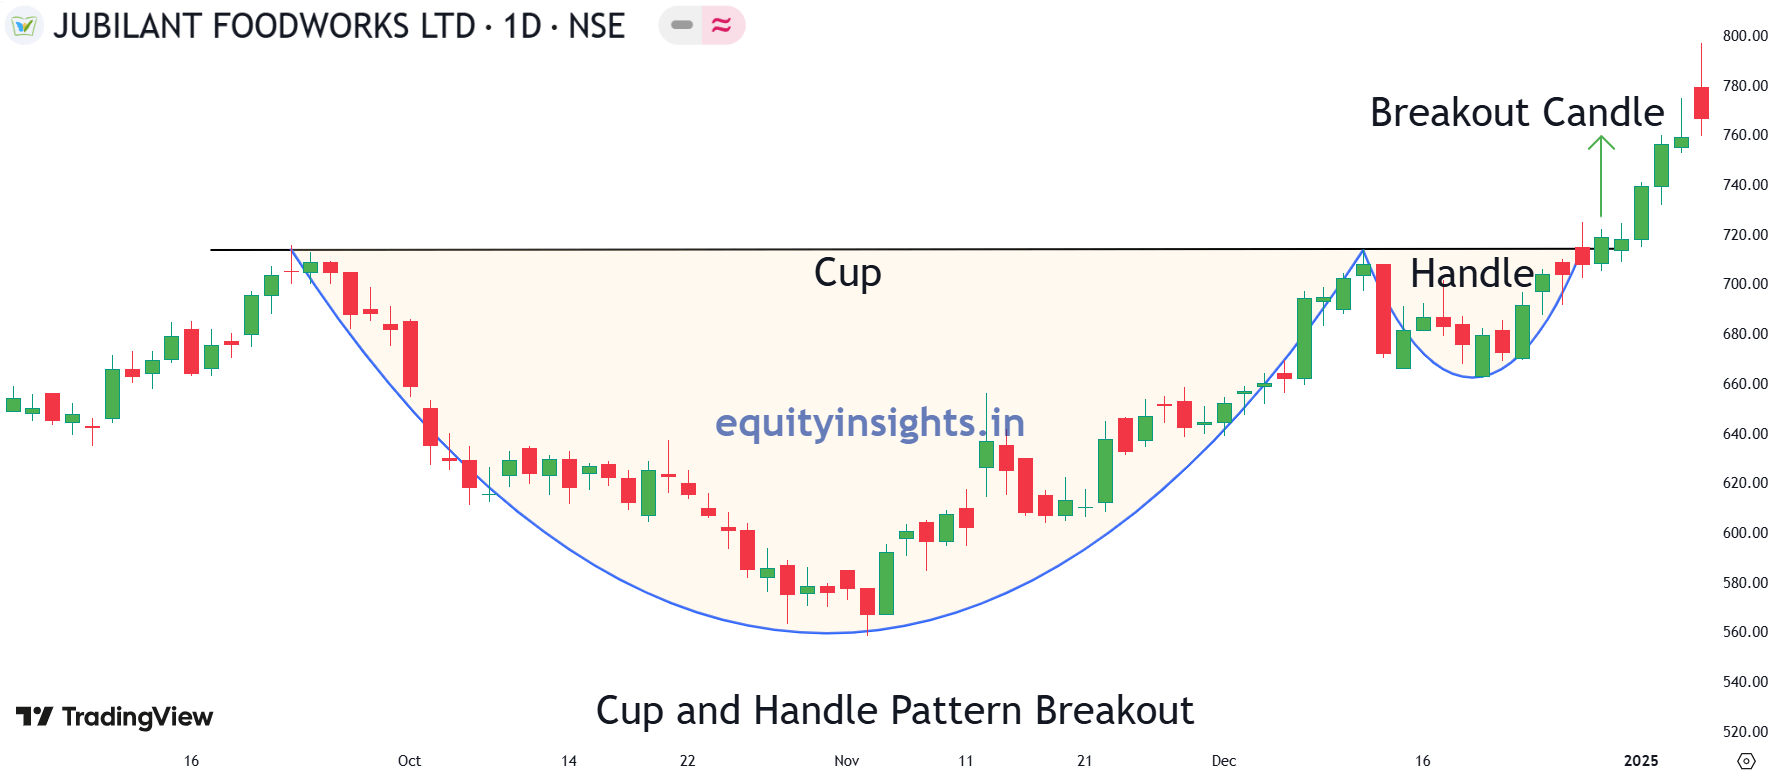
Cup and Handle Pattern Breakout – A Cup and Handle breakout is confirmed when the price moves above the handle’s resistance. A high-volume breakout signals a strong entry opportunity, with a stop loss set below the handle’s low and a target measured by adding the cup’s depth to the breakout level.
2. Triangle Patterns: A triangle pattern is a technical analysis chart pattern that forms when the price of an asset moves within converging trend lines, creating a triangle shape. It represents a period of consolidation before the price eventually breaks out in either direction. Triangle patterns are used by traders to predict future price movements based on the breakout direction. There are three types of Triangle Patterns:
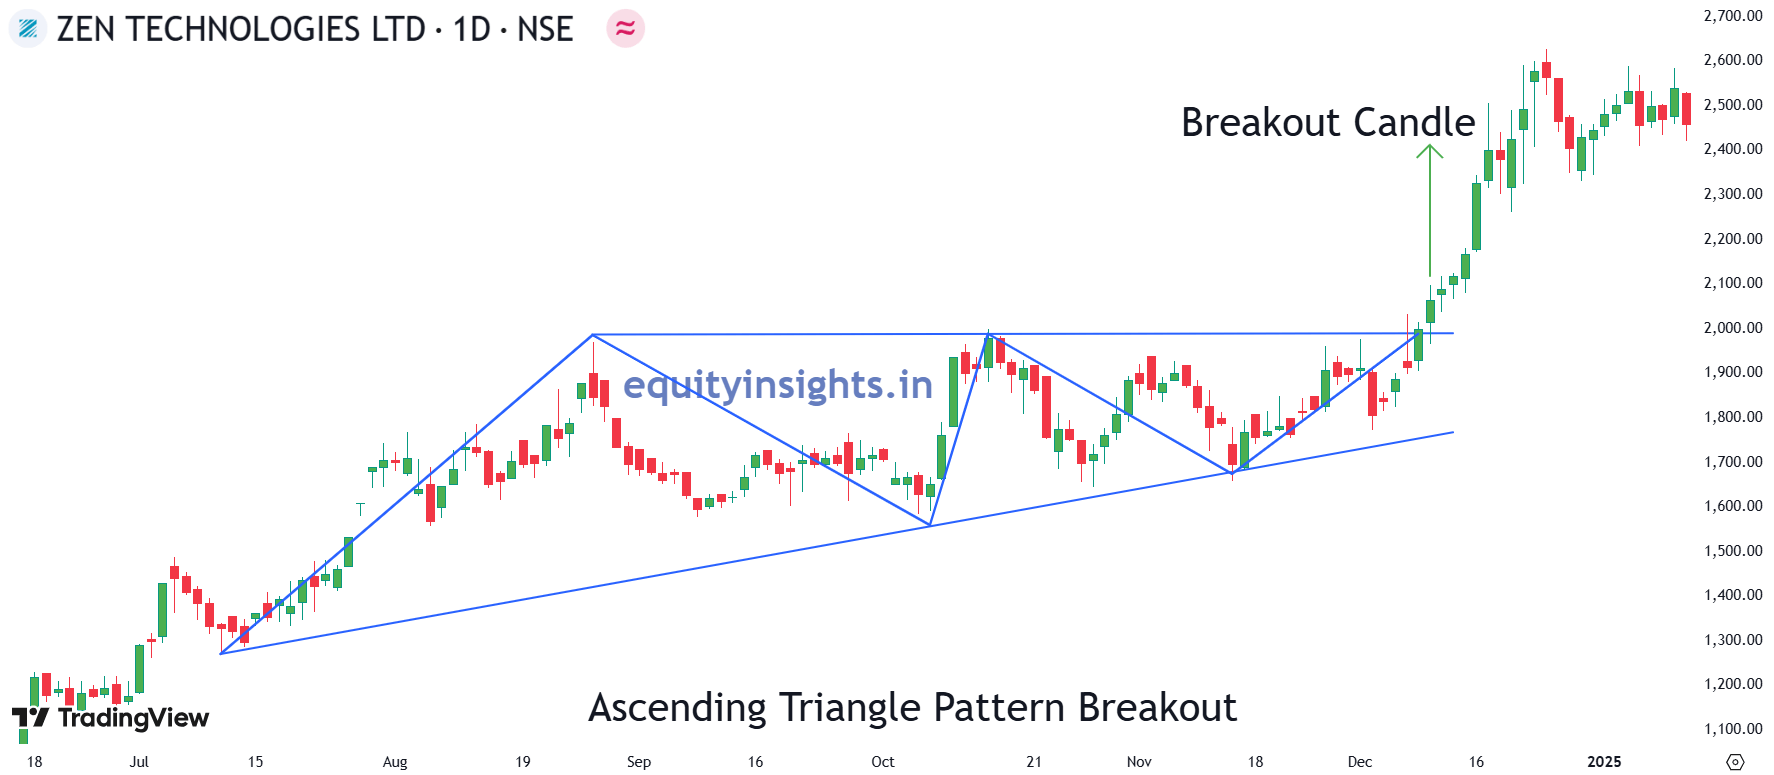
- Ascending Triangle
- Formation: A horizontal resistance line at the top and an upward-sloping support line at the bottom.
- Interpretation: Buyers are gaining strength, pushing prices higher. A breakout above resistance indicates bullish momentum.
- Formation: A horizontal resistance line at the top and an upward-sloping support line at the bottom.
- Descending Triangle
- Formation: A horizontal support line at the bottom and a downward-sloping resistance line at the top.
- Interpretation: Sellers are in control and prices are likely to break downward. A breakout below support suggests bearish momentum.
- Formation: A horizontal support line at the bottom and a downward-sloping resistance line at the top.
- Symmetrical Triangle
- Formation: Both support and resistance lines slope toward each other, creating a symmetrical shape.
- Interpretation: Indicates market indecision. The price can break out in either direction, depending on the previous trend.
- Formation: Both support and resistance lines slope toward each other, creating a symmetrical shape.
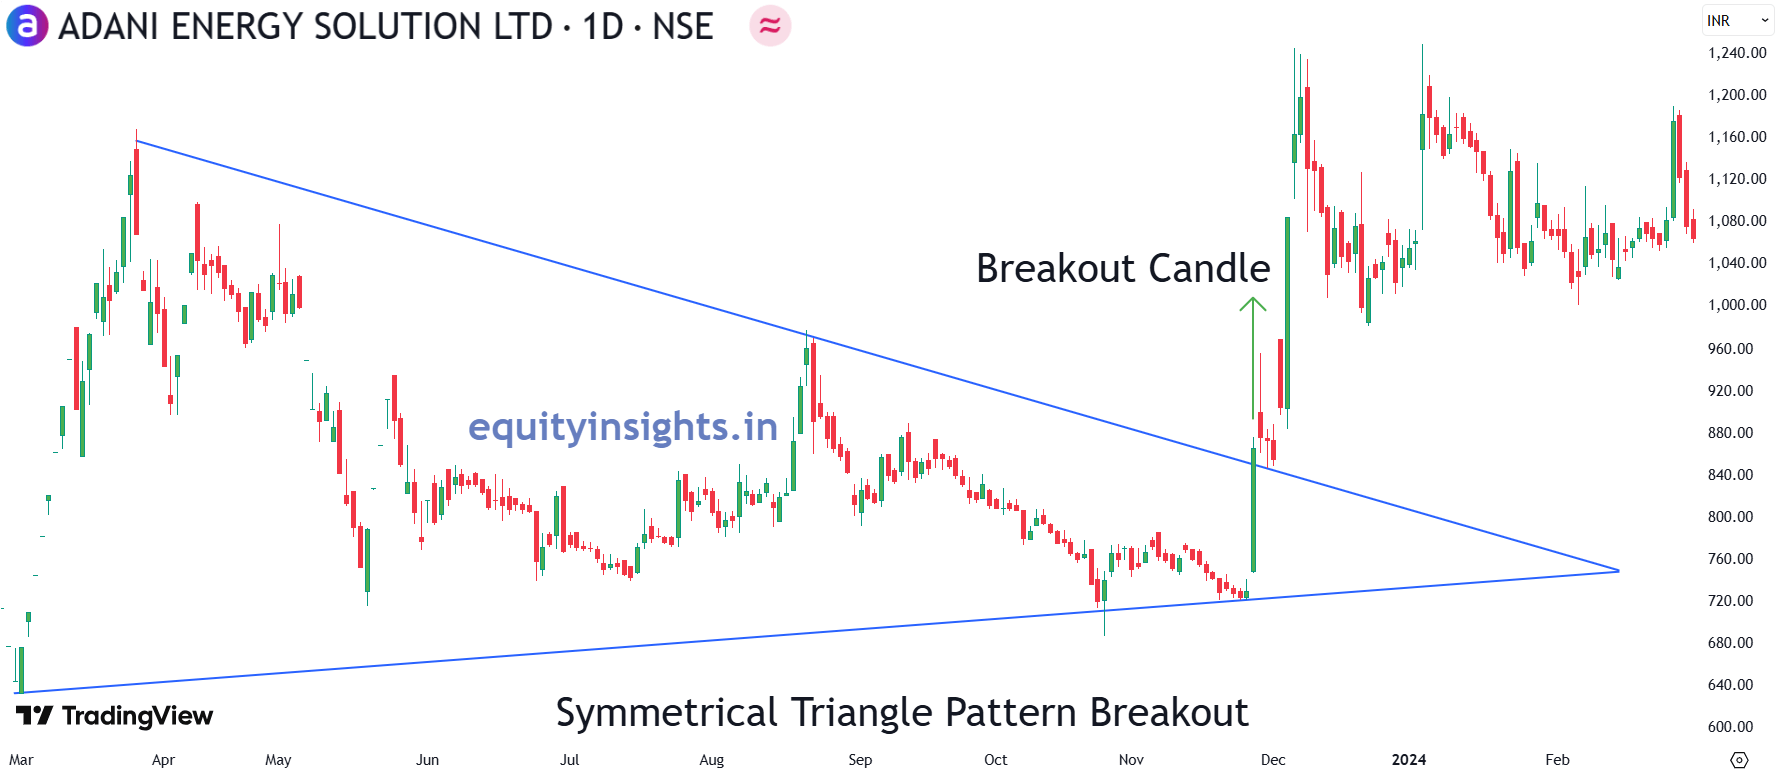
Triangle Breakout – A triangle breakout can be identified once the price of a security breaks through the upper trend line of a symmetrical and ascending triangle while a descending triangle is used to identify the breakdown trade. The triangle pattern (ascending, descending or symmetrical) signals consolidation before a strong move. A breakout above or below the triangle with high volume confirms the trade, with a stop loss placed just beyond the breakout point and a target projected based on the triangle’s height.
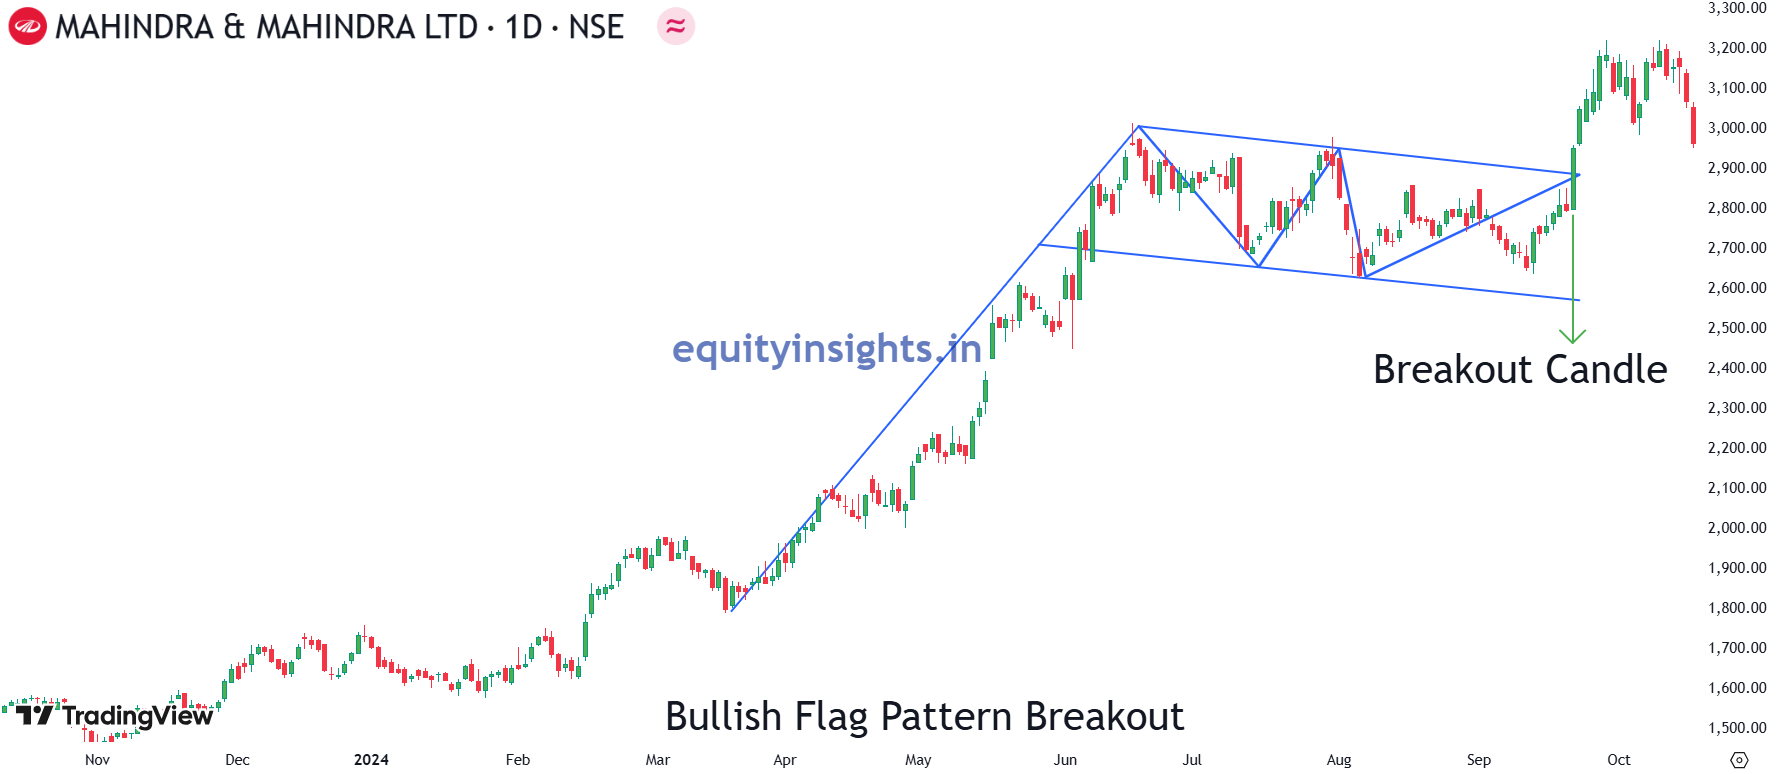
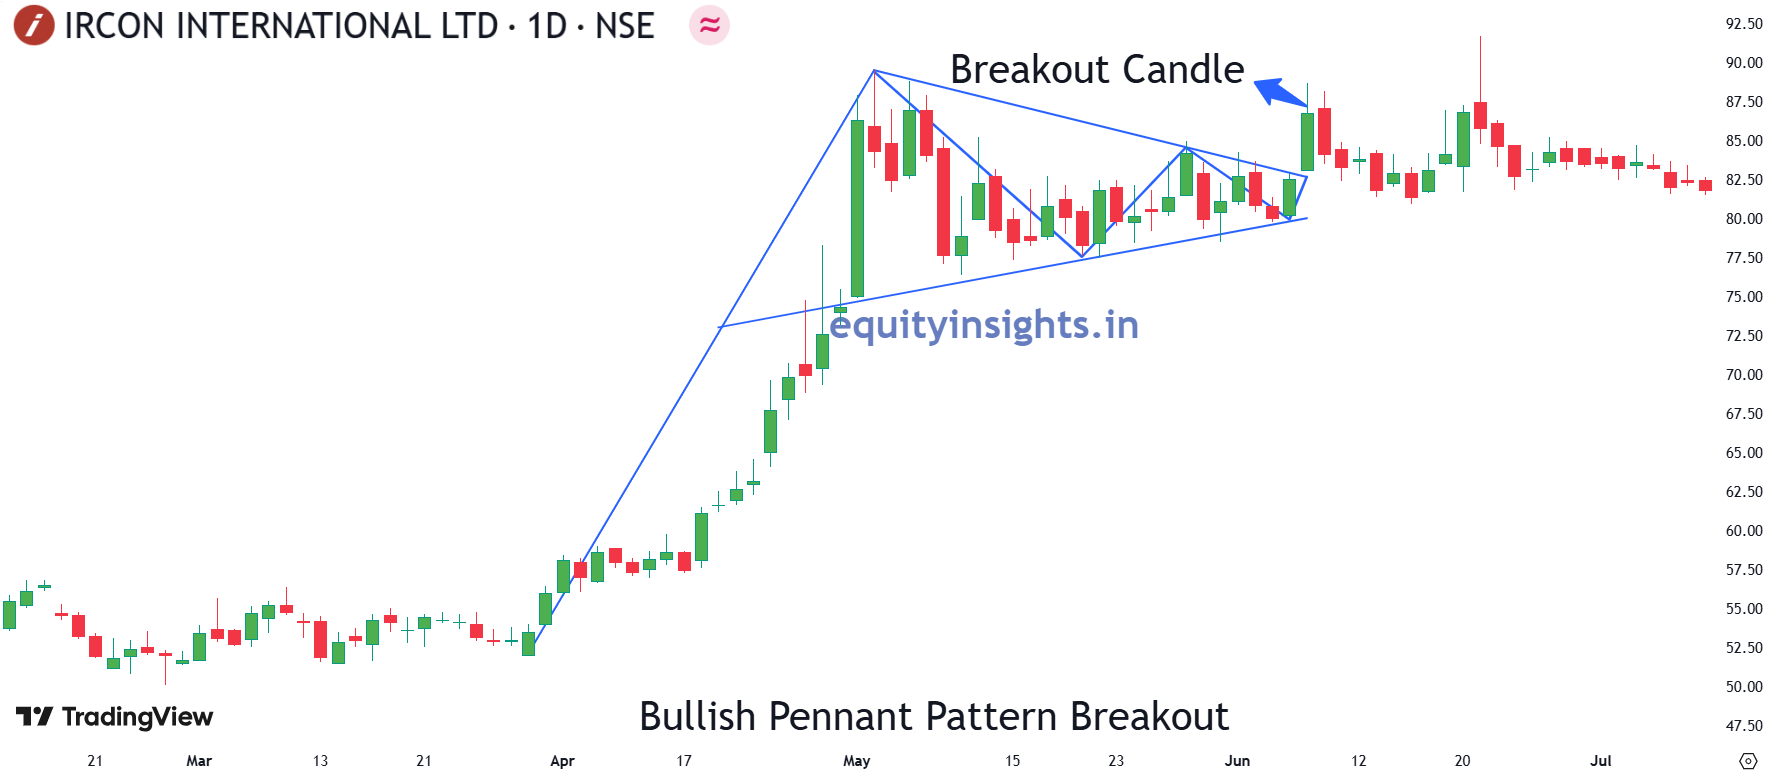
3. Flag and Pennant Patterns: Flag and Pennant patterns are two of the most reliable continuation patterns in technical analysis, signaling a temporary consolidation before the price resumes its previous trend. These patterns typically appear after a strong price movement (called the “flag & pole”), followed by a brief pause and then a breakout in the same direction as the initial trend. Both patterns indicate that the market is taking a short break before continuing its movement.
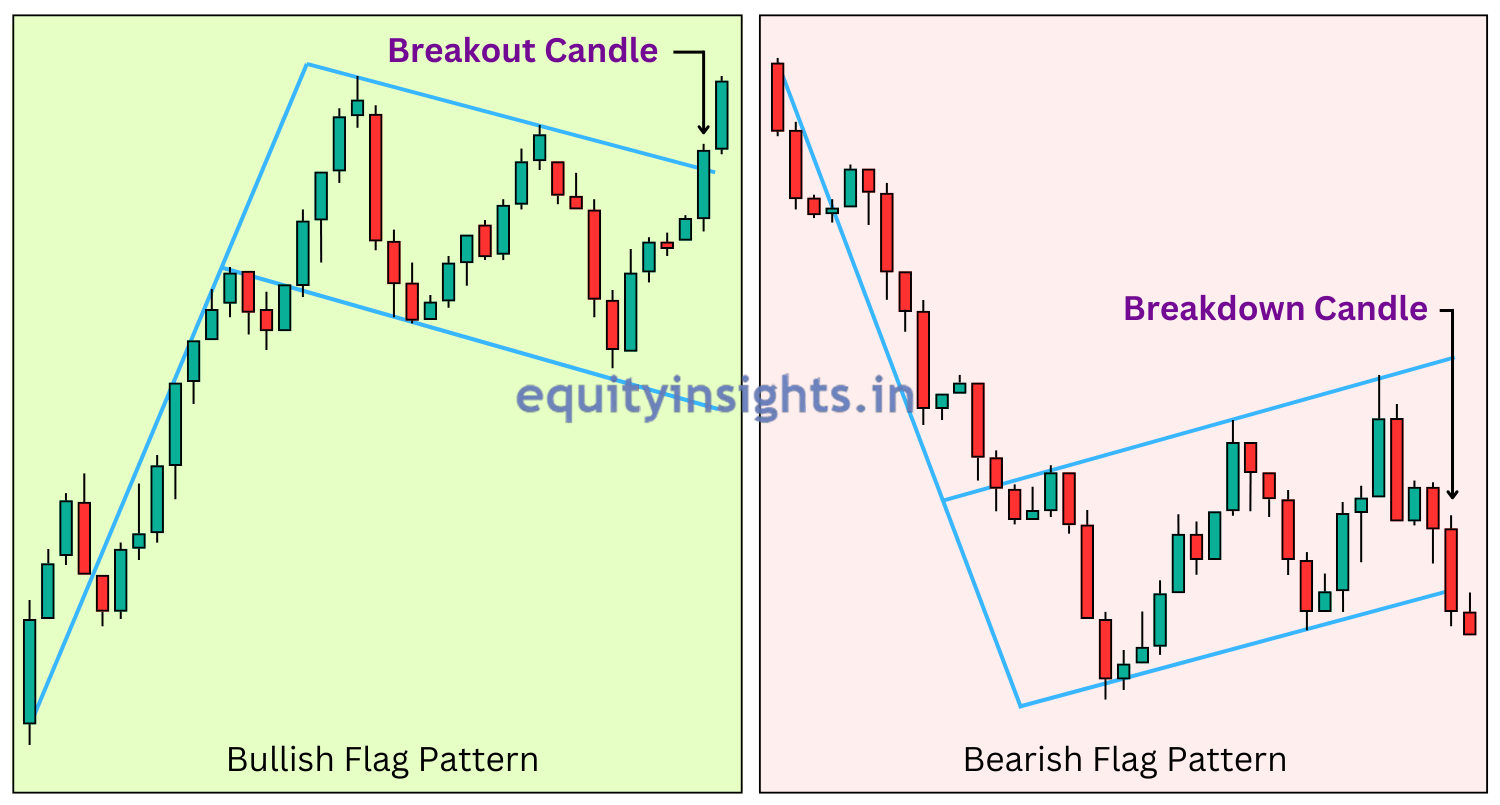
- Flag Pattern: A flag pattern forms when the price moves sharply in one direction (up or down), followed by a brief period of consolidation where the price moves within a small parallel channel, either sloping against the trend or sideways. This pattern resembles a flag on a pole. Once the price breaks out of the flag formation, it typically continues in the direction of the original trend. There are two types of flag patterns:
- Bullish Flag: Occurs after a strong upward move, with the flag portion sloping slightly downward or moving sideways. A breakout above the flag signals a continuation of the uptrend.
- Bearish Flag: Forms after a sharp downward move, with the flag portion sloping upward or staying flat. A breakdown below the flag signals further downside movement.
- Bullish Flag: Occurs after a strong upward move, with the flag portion sloping slightly downward or moving sideways. A breakout above the flag signals a continuation of the uptrend.
- Pennant Pattern: A pennant pattern is similar to a flag but has a triangular shape instead of a parallel channel. After a strong price movement, the price consolidates within a small symmetrical triangle, with converging trend lines. A breakout from the pennant signals the continuation of the original trend. Like flags, pennants can also be bullish or bearish, depending on the trend direction before consolidation.
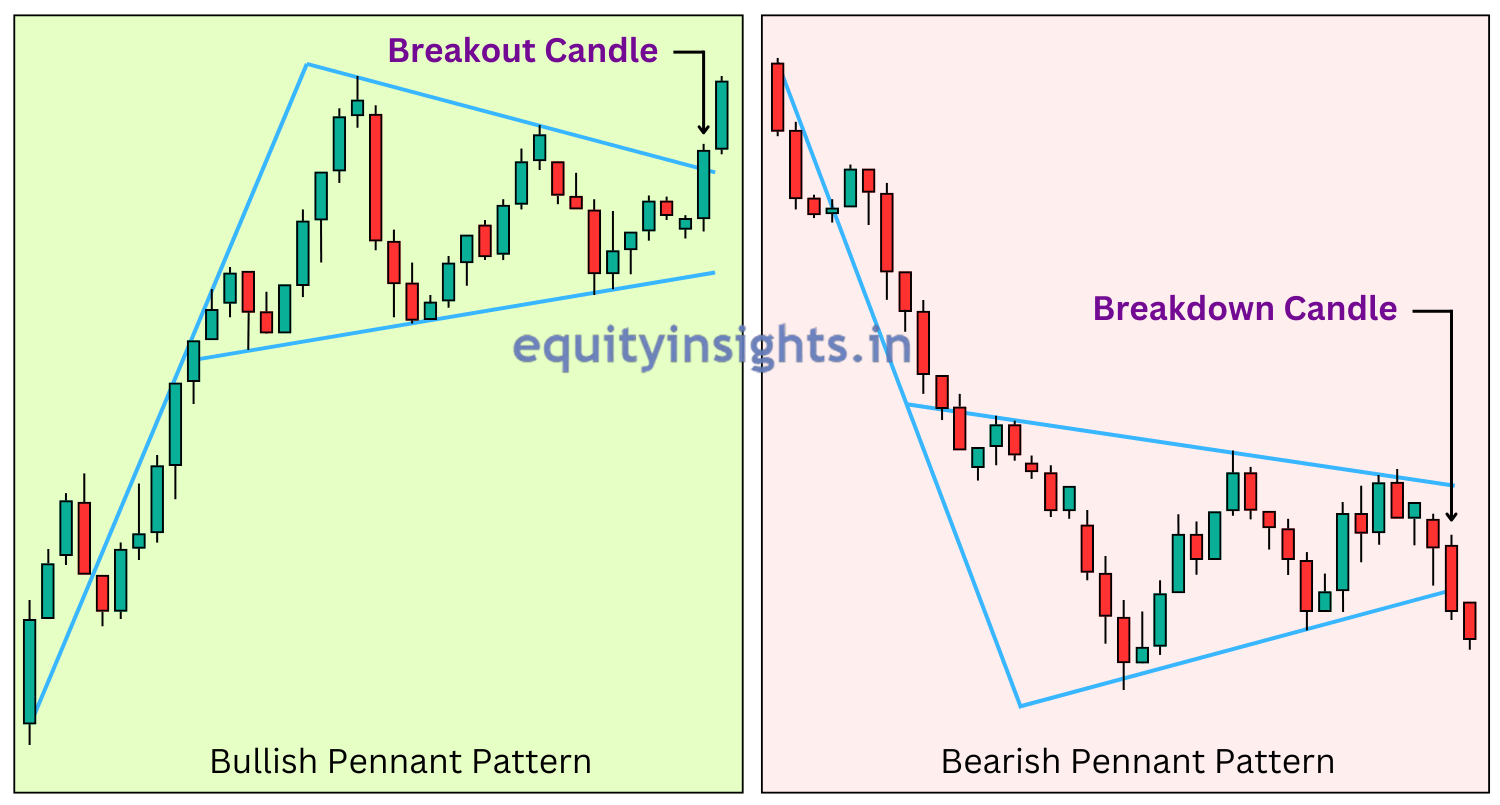
Flag and Pennant Breakout – A breakout from the flag or pennant patterns usually occurs after the price has moved in one direction and has consolidated for a while. A breakout in the direction of the trend with strong volume provides an entry signal, while the stop loss is placed below the flag or pennant and the target is projected based on the pennant’s height. Once the stock price breaks out from the pattern, traders can expect the trend to continue.
4. Inverted Head and Shoulders Pattern: The Head and Shoulders pattern is a widely recognized trend reversal pattern in technical analysis, signaling a shift from a bullish to a bearish trend or vice versa while the Inverse Head and Shoulders pattern is the opposite of the standard pattern and signals a potential bullish reversal after the breakout. It forms after a downtrend and consists of:
- Left Shoulder: The price drops to a low and then rises.
- Head: A lower low is formed, followed by an upward move.
- Right Shoulder: The price falls again but forms a higher low, showing signs of strength.
- Neckline: The resistance level connecting the highs of the two shoulders. A breakout above the neckline confirms the bullish reversal, indicating a potential buying opportunity.
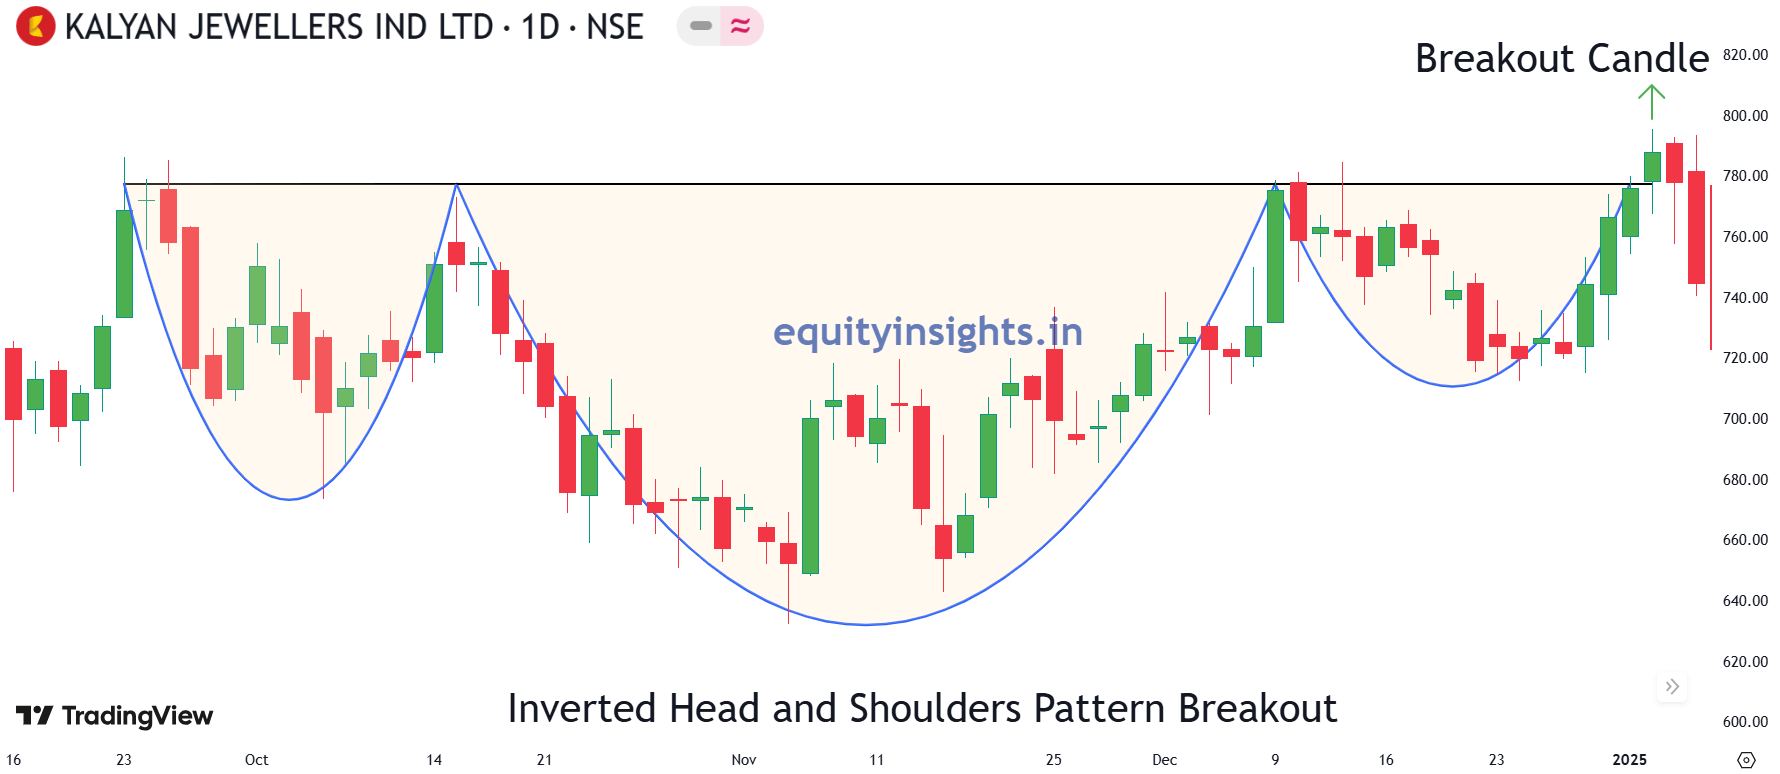
Inverted Head and Shoulders Breakout – The inverted head and shoulders pattern, a reversal formation, signals a trend change. An inverted head and shoulders pattern has a neckline. A breakout above the neckline confirms a bullish breakout. The stop loss is placed below the right shoulder, with a target projected based on the distance from the head to the neckline.
Each of these strategies will be covered in detail in the upcoming articles, equipping you with the right tools to trade successfully!
Also Read: Trading Economics: How Economic Events Impact Stock Market?
Common Breakout Strategy that is applicable in all the Above Strategies
Here’s a step-by-step guide to trading breakout stocks successfully:
1. Identify the Right Stocks for Breakout Trading – Not all stocks make good breakout candidates. Look for stocks that:
- Have a history of strong price movements.
- Show a clear resistance forming over time.
- Have increasing volume and volatility, indicating accumulation.
Breakout trading works best in chart patterns. So, look for stocks consolidating in a tight range, forming key chart patterns like:
- Ascending/Descending/Symmetrical Triangles – Signals trend continuation.
- Cup and Handle – A bullish breakout pattern.
- Flag & Pennant – Short-term consolidation before a strong move.
- Inverted Head and Shoulders – A reversal breakout pattern.
You can use stock screeners like TradingView to find stocks with strong consolidation near resistance levels.
2. Wait for a Strong Breakout with High Volume – A breakout is only valid if confirmed by volume. A true breakout happens when the price breaks a key level with a strong volume. If a stock breaks resistance but lacks volume, it may be a false breakout. High volume signals strong institutional interest, increasing the chances of a sustained move.
You should look if the volume is 1.5x to 2x the average daily volume at the time of breakout. Example: If a stock has been trading at ₹50 for weeks, a strong breakout above ₹50 with high volume confirms a valid move.
3. Enter the Trade with Proper Timing – There are two ways to enter a breakout trade:
- Aggressive Entry: Enter immediately when the price breaks the resistance/support level with high volume.
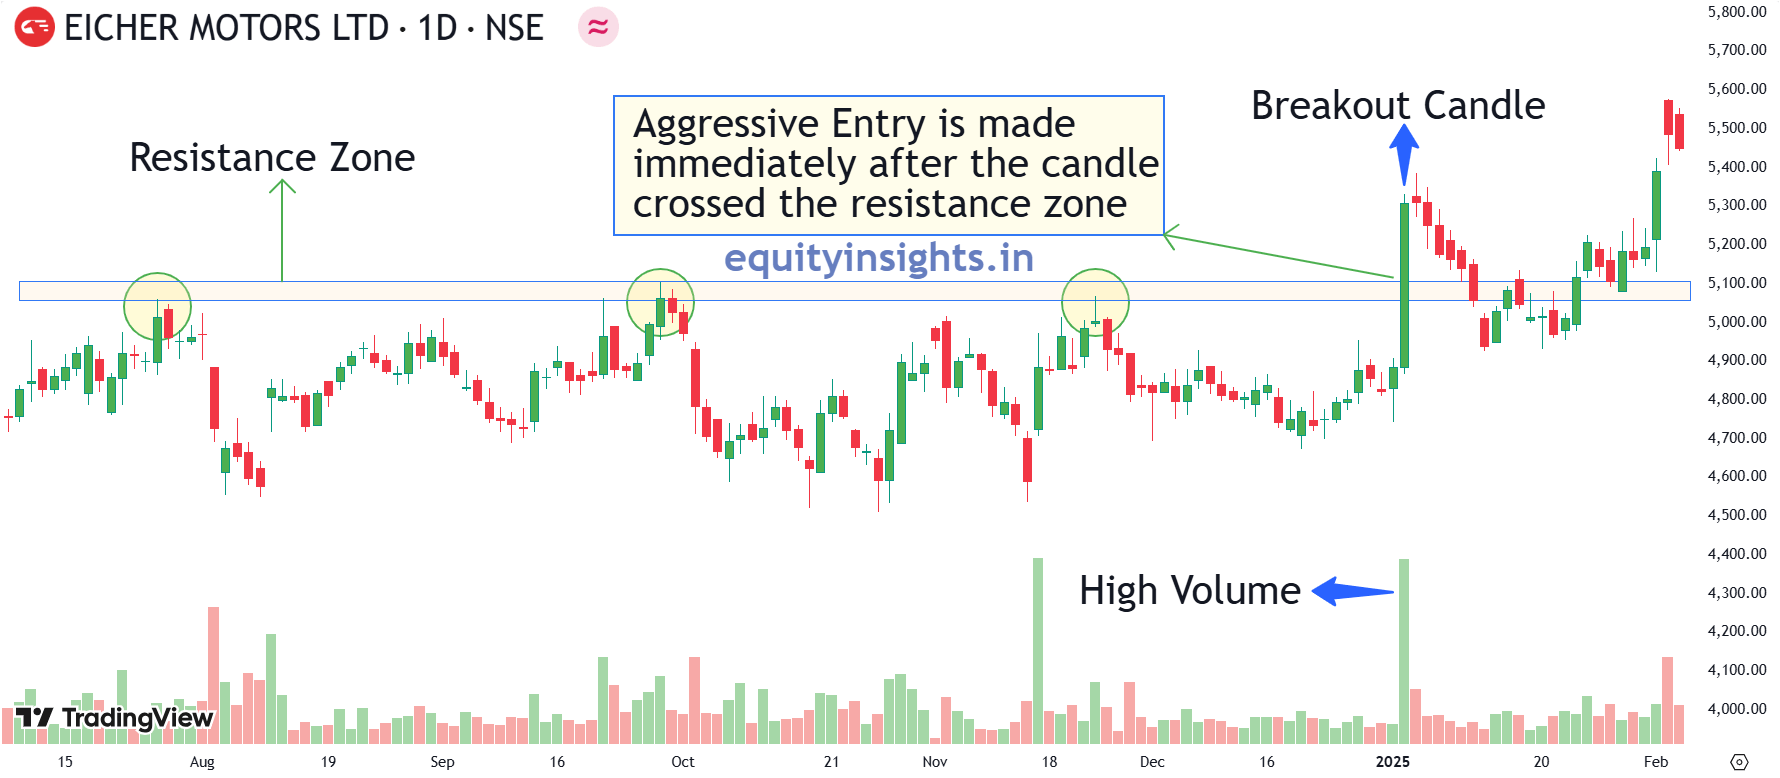
- Conservative Entry: Wait for a retest of the breakout level to confirm support before entering.
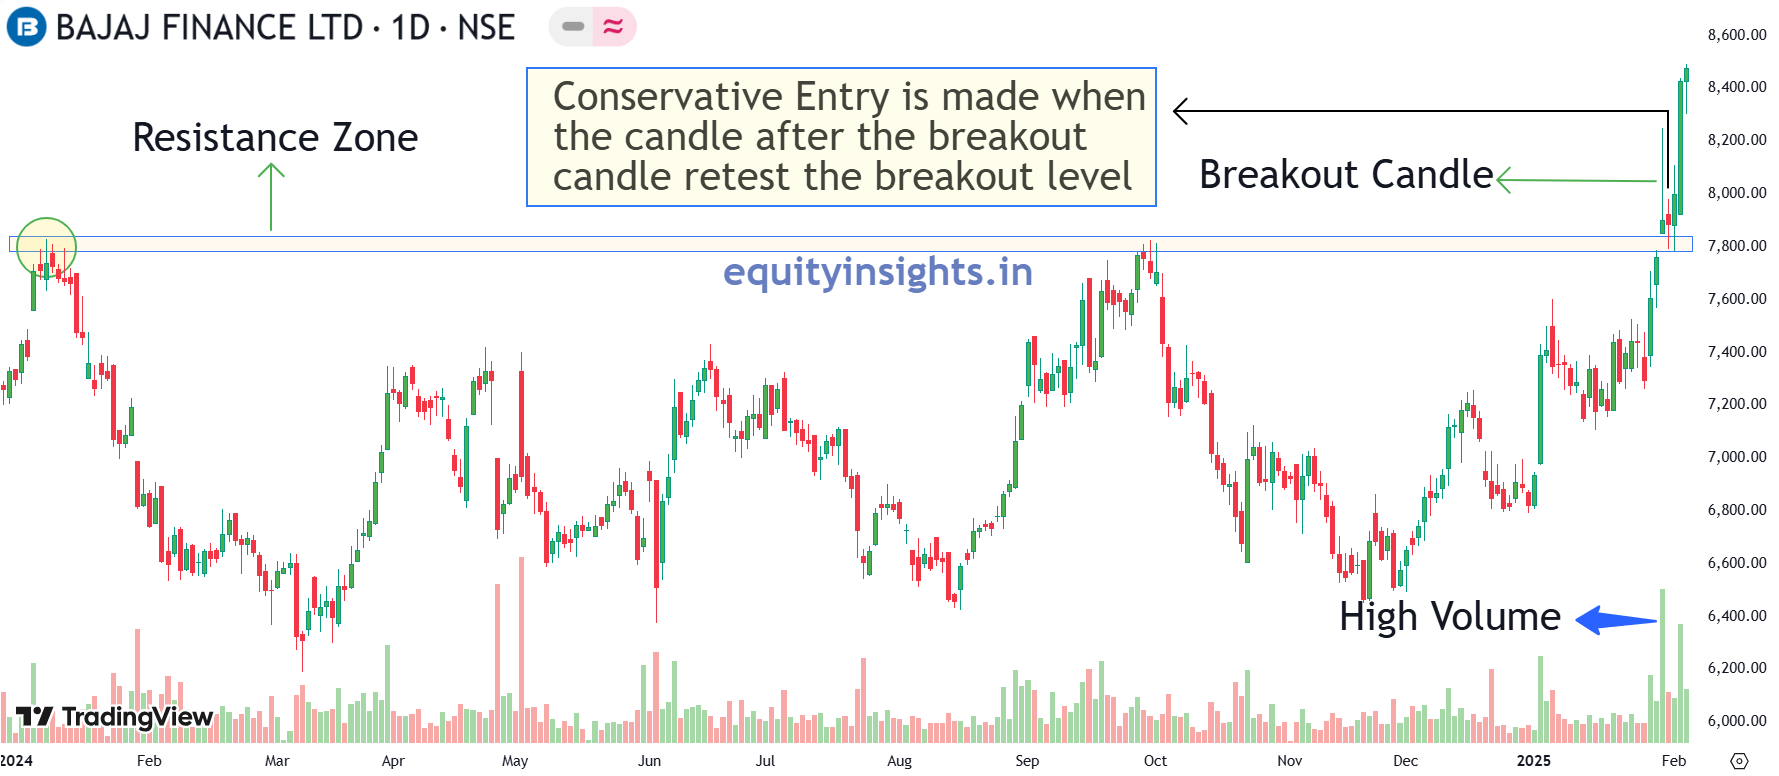
Example: If a stock breaks out above ₹100 and you enter immediately at ₹101, it’s called an aggressive entry. However, if the stock retests ₹100, holds above it, and then you enter, it’s a conservative entry. It is a stronger confirmation of the breakout.
4. Set Stop Loss to Minimize Risk – Risk management is key in breakout trading. Stop loss ensures you don’t get caught in false breakouts. Place your stop loss:
- Below the breakout level (for bullish breakouts).
- Keep the risk-reward ratio of at least 1:2 (Risking $1 to gain $2).
Example: If you enter a breakout trade at ₹50, place a stop loss at ₹48 or ₹49 to protect against false breakouts with a target of ₹54.
5. Define a Profit Target Using Measured Moves – Ideally, a trader should aim for a profit target at least twice the risk taken. However, beyond this, there are additional factors to consider when setting a profit target:
- Measure the height of the consolidation pattern and add it to the breakout level.
- Previous Resistance: Set a target near past resistance zones.
Example: If a stock consolidates between ₹90 and ₹100, the height is ₹10. A breakout above ₹100 could have a target of ₹110 (₹100 + ₹10). However, this should be the minimum target and one should look for risk to reward ratio of 1:2 which sets the target of ₹120 unless there is any resistance in between.
6. Manage the Trade with Trailing Stop Loss – Once the stock moves in your favour, lock in profits by using a trailing stop loss. Move the stop loss to a profit of 2%, after a 3-5% move and use a trailing stop loss (e.g. 2% below the current price) to maximize gains. This allows you to stay in the trade while securing gains if the trend reverses.
Example: If a stock breaks out from ₹100 to ₹110, move your stop loss from ₹100 to ₹105 to protect profits.
7. Avoid Common Breakout Trading Mistakes
- Chasing late breakouts – Wait for confirmation before entering.
- Ignoring volume – Low-volume breakouts often fail.
- Not using stop loss – A single loss can wipe out gains.
- Trading against the trend – Breakouts work best in trending markets.
Breakout Trading Strategy Example:
- Find a stock consolidating near resistance (₹50) and say the stock was consolidating in the range of ₹45-₹50.
- Wait for a breakout above ₹50 with high volume.
- Enter at ₹51 after confirming breakout strength.
- Set stop loss at ₹48 to limit risk.
- Target ₹57 based on risk to reward ratio of 1:2 at least.
- Adjust stop loss as price moves up to lock in profits.
By following these breakout trading principles, you can maximize gains while minimizing risks.
Also Read: Investment: The Key to Secure Your Financial Future
Essential Factors to Consider Before Trading or Investing in Breakout Stocks
Investing in breakout stocks can be highly rewarding, but it also comes with risks. To maximize gains while minimizing potential losses, traders must consider several crucial factors before making a move. Let’s break them down:
While trading a breakout or breakdown, traders should keep an eye on several things.
1. Master the Concept of Breakouts – Before diving into breakout trading, you need a solid understanding of what breakouts are, how they work and their different types. Correctly identify the breakout levels. Make sure you mark the support levels, resistance levels, and trend lines accurately. Additionally, learning how to identify a breakout using technical indicators is key to making informed decisions.
2. Research & Analysis – Identify candlestick patterns that can help you capture breakout trading opportunities. Once you’ve identified a breakout stock, conduct thorough research:
- Fundamental Analysis – Evaluate the company’s financial health, growth potential and competitive position.
- Technical Analysis – Study price charts, volume trends, and key technical indicators to gauge the stock’s momentum.
3. Look for Confirmation Signals – Not all breakouts lead to sustained uptrends! Confirm the breakout using multiple technical indicators, especially high trading volume, which strengthens the breakout’s credibility.
4. Assess Risk vs Reward – Understand the risk-reward ratio before entering a trade. How much are you willing to risk for a potential gain? Set stop loss orders to limit your downside and avoid significant losses.
5. Smart Position Sizing – Never put all your capital into a single trade! Diversify your investments across multiple stocks to reduce risk and protect your portfolio from unexpected market fluctuations.
6. Plan Your Entry & Exit – Successful trading isn’t just about picking the right stock—it’s about timing. Define:
- Entry Point – When and why you’ll enter a trade.
- Exit Strategy – Your profit targets and stop loss levels to exit at the right time.
7. Stay Updated & Adapt – Market trends, news and economic events can impact stock prices. Stay informed and adjust your strategy based on current developments to stay ahead in the game.
8. Keep Learning & Improving – The stock market is constantly evolving. Keep sharpening your skills by learning new trading strategies, market trends and risk management techniques to improve your breakout trading success.
9. Discipline & Patience are Key – Emotions can be a trader’s worst enemy! Stick to your trading plan, stay disciplined and avoid impulsive decisions to ensure long-term success.
Final Thought: Breakout trading is an art that requires strategy, patience and continuous learning. Breakout trading is a powerful strategy, but discipline is key. Always follow:
- Trend-based trading
- Volume confirmation
- Proper risk management
Also Read: Stock Analysis: Things to Follow & Avoid in the Stock Market
Conclusion
Trading breakouts can prove to be a rewarding trading strategy and is applicable across various asset classes. Correctly identifying and confirming a breakout are key aspects of a breakout trading strategy. Similar to another trading strategy, following sound risk management principles can help traders preserve their capital.
Disclaimer: The information provided in this article is intended solely for educational, illustrative and awareness purposes. Nothing contained herein should be construed as a recommendation. Users are encouraged to seek professional financial advice before making any decisions based on the content provided.